
May 16, 2014
Written by C.N.
Asian Pacific American Heritage Month: Facts for 2014
You may know that May is Asian Pacific American (APA) Heritage Month. To recognize this occasion, the U.S. Census Bureau has released its annual “Facts for Figures” report that summarizes some interesting demographic facts and data about the APA population. Below are a few interesting data tidbits:
18.9 million
The estimated number of U.S. residents in 2012 who said they were Asian alone or Asian in combination with one or more other races. This group comprised slightly less than 6 percent of the total U.S. population.46.0%
Percentage growth of the Asian alone or in combination population between the 2000 and 2010 censuses, which was more than any other major race group.4.2 million
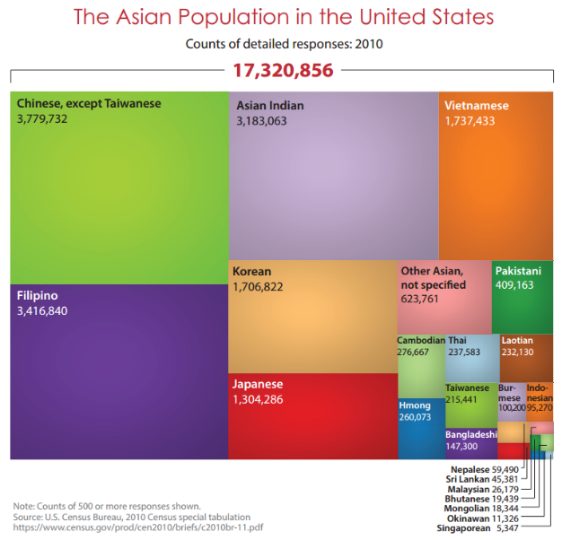
Number of Asians of Chinese, except Taiwanese, descent in the U.S. in 2012. The Chinese (except Taiwanese) population was the largest Asian group, followed by Filipinos (3.6 million), Asian Indians (3.3 million), Vietnamese (1.9 million), Koreans (1.8 million) and Japanese (1.3 million). These estimates represent the number of people who reported a specific detailed Asian group alone, as well as people who reported that detailed Asian group in combination with one or more other detailed Asian groups or another race(s).$70,644
Median income of households headed by the Asian alone population in 2012. Median household income differed greatly by Asian group. For Asian Indians, for example, the median income in 2012 was $96,782; for Bangladeshi, it was $44,293. (These figures represent the Asian alone population.)50.5%
The percentage of the Asian alone population 25 and older who had a bachelor’s degree or higher level of education. This compared with 29.1 percent for all Americans 25 and older.21.2%
The percentage of 25-and-older Asian alone population who had a graduate or professional degree. This compared with 10.9 percent for all Americans 25 and older.49.1%
The proportion of civilian employed Asian alone population 16 and older who worked in management, business, science and arts occupations, such as financial managers, engineers, teachers and registered nurses in 2012. Additionally, 17.3 percent worked in service occupations, 20.6 percent in sales and office occupations, 9.7 percent in production, transportation and material moving occupations and 3.2 percent in natural resources, construction and maintenance occupations.88.6%
Percentage of Asian alone population in 2012 living in a household with Internet use — the highest rate among race and ethnic groups.
Author Citation
Copyright © 2001- by C.N. Le. Some rights reserved. 
Suggested reference: Le, C.N. . "Asian Pacific American Heritage Month: Facts for 2014" Asian-Nation: The Landscape of Asian America. <https://www.asian-nation.org/headlines/2014/05/asian-pacific-american-heritage-month-facts-for-2014/> ().
Short URL: https://www.asian-nation.org/headlines/?p=1949
Tags:
Translate Into Another Language![]()