The views and opinions expressed on this site and blog posts (excluding comments on blog posts left by others) are entirely my own and do not represent those of any employer or organization with whom I am currently or previously have been associated.
Academic Version: Applying my personal experiences and academic research as a professor of Sociology and Asian American Studies to provide a more complete understanding of political, economic, and cultural issues and current events related to American race relations, and Asia/Asian America in particular.
Plain English: Trying to put my Ph.D. to good use.
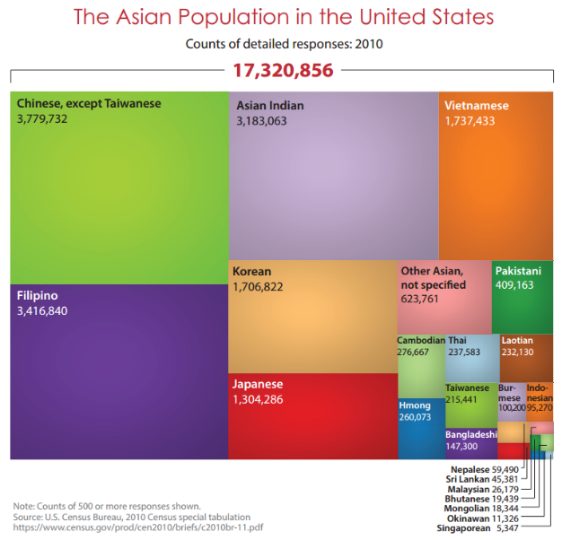
You may know that May is Asian Pacific American (APA) Heritage Month. To recognize this occasion, the U.S. Census Bureau has released its annual “Facts for Figures” report that summarizes some interesting demographic facts and data about the APA population. Below are a few interesting data tidbits:
18.9 million
The estimated number of U.S. residents in 2012 who said they were Asian alone or Asian in combination with one or more other races. This group comprised slightly less than 6 percent of the total U.S. population.
46.0%
Percentage growth of the Asian alone or in combination population between the 2000 and 2010 censuses, which was more than any other major race group.
4.2 million
Number of Asians of Chinese, except Taiwanese, descent in the U.S. in 2012. The Chinese (except Taiwanese) population was the largest Asian group, followed by Filipinos (3.6 million), Asian Indians (3.3 million), Vietnamese (1.9 million), Koreans (1.8 million) and Japanese (1.3 million). These estimates represent the number of people who reported a specific detailed Asian group alone, as well as people who reported that detailed Asian group in combination with one or more other detailed Asian groups or another race(s).
$70,644
Median income of households headed by the Asian alone population in 2012. Median household income differed greatly by Asian group. For Asian Indians, for example, the median income in 2012 was $96,782; for Bangladeshi, it was $44,293. (These figures represent the Asian alone population.)
50.5%
The percentage of the Asian alone population 25 and older who had a bachelor’s degree or higher level of education. This compared with 29.1 percent for all Americans 25 and older.
21.2%
The percentage of 25-and-older Asian alone population who had a graduate or professional degree. This compared with 10.9 percent for all Americans 25 and older.
49.1%
The proportion of civilian employed Asian alone population 16 and older who worked in management, business, science and arts occupations, such as financial managers, engineers, teachers and registered nurses in 2012. Additionally, 17.3 percent worked in service occupations, 20.6 percent in sales and office occupations, 9.7 percent in production, transportation and material moving occupations and 3.2 percent in natural resources, construction and maintenance occupations.
88.6%
Percentage of Asian alone population in 2012 living in a household with Internet use — the highest rate among race and ethnic groups.
Recent news on the higher education scene has turned attention to the Asian American case, or cases we should say. A team of education researchers led by Dr. Robert Teranishi used data from the Census Bureau’s American Community Survey and the University of California higher education system to make the case that Asian American ethnic groups are not all performing in the “model minority” way. As some readers know, Asian Americans tend to be grouped together as if they were a racial equivalent to “white†“black†and sometimes “Hispanic.”
When this kind of grouping occurs, scholars and interested citizens look for similarities and differences between racial groups on outcomes like educational attainment, household income, poverty levels, health etc. From this classification approach Asian Americans tend to appear exemplary on a number of outcomes. Take for example, last year’s Pew report on Asian Americans. Using the American Community Survey, Pew shows an aggregate figure for bachelor’s degree attainment and median household income in 2010 for Asian Americans. As the title of their figure states “Asian Americans Lead Others in Education, Income.â€
Teranishi and colleagues’ report disaggregates, that is, splits into smaller groups, the Asian American classification using the same data, and this is what they find. In this first graph we see bachelor’s degree attainment across multiple Asian American groups and we find surprising differences across the board. At the one end, Taiwanese and Asian Indian Americans report over 71% within each group with a bachelor’s degree. At the other end, about 12% of Laotian and 15% of Hmong Americans claim the same educational attainment. So while it is the case that Asian Americans as a group appear to have a lot of education, the reality is that only certain groups are showing this level attainment.
Now let’s look at household income. Using the median household income ($66,000 according to the Pew report) for all Asian Americans, Teranishi et al. disaggregate that figure and show the following.
As you can see, at one extreme, Asian Indian Americans exceed the Asian American household income mean by over $21,000 on average. Hmong Americans are below that same mean by almost the same amount. In fact 9 out of the 15 groups are below the Asian American mean. And 7 of these groups are lower than the white American average.
What this suggests is that Asian Americans are highly diverse socioeconomically. To the extent that the model minority myth is applied to this collection of SES-diverse groups, it masks the evident differences among them. Read the full report here to find out more about the benefits of disaggregation especially in higher education within the University of California system. Similar kinds of analyses were conducted by Dr. Paul Ong and associates who disaggregated homeownership and cash public assistance rates across Asian ethnic groups in several different areas of the US.
The slide show report on some of their findings is here, and the regional reports are here. Like Teranishi et al.’s report, disaggregation of Asian American homeownership, other assets and public assistance shows that the rates of these socioeconomic patterns vary a lot by Asian ethnic group.
Some might ask: then why is the overall Asian American average so high to begin with. The answer is a matter of population size. Look back at the disaggregated figures. Pick out these groups: Chinese, Filipino, Indian, Vietnamese, Korean, and Japanese. These groups take up 83% of all Asian Americans. Statistically, the other groups are not numerically large enough to alter the educational attainment or household income average of the largest six groups since they take up a greater share of the population. We should remember too, sizable numbers of Asian Americans in the larger groups do not share in the picture of “success†that their same-ethnic peers experience.
In our racialized society, we like our groups to be simple; we prefer to ignore the diverse realities within the groupings we create. By using “Asian American†as shorthand for “the successful minority†we mask major differences in the outcomes that presumably all Asian Americans share. Notably, our social programs often utilize this assumption and give next to nothing for vulnerable Asian Americans. This in turn makes Asian American inequalities invisible.
Hopefully more leaders and concerned citizens will grow aware of the problem we create when we use the stereotype of “the high –achieving, hard-working minority.†Reports and studies, like the one produced by Dr. Teranishi that disaggregate the Asian American data story expand our own understanding that this story is not just diverse culturally, but socioeconomically as well.
One of the most popular and controversial articles on my Asian-Nation.org site is the one on Interracial Dating and Marriage. This is a topic that has provoked much discussion and debate among Asian Americans through the years and continues to do so today. Within the larger range of opinions on interracial dating and marriage, many Asian Americans and non-Asians alike consider dating and marrying someone outside of your racial/ethnic group as a natural progression of Asian Americans becoming more integrated into the mainstream, while others see it as renouncing one’s Asian identity.
As the saying goes, you are entitled to your opinion, but not your facts. In that context, as a sociologist, I try to make an empirically-sound and objective contribution to this debate by presenting updated data and statistics from the 2010 U.S. Census American Community Survey (ACS) on the racial/ethnic marriage patterns of Asian Americans for both men and women and the six largest Asian ethnic groups. The full tables are presented in my Interracial Dating and Marriage page, but below is a summary of recent trends and changes from 2006, the last time I updated these statistics:
Consistently, rates of marriages involving Asian Americans and Whites have declined. Specifically, among those marriages in which both spouses are U.S.-raised (either born in the U.S. or immigrated before age 13, and thereby socialized within the U.S. racial/ethnic landscape), for five of the six Asian American ethnic groups, the rates of having a White spouse for both men and women declined from 2006 to 2010. Among men/husbands, the largest decline involved Asian Indians and Koreans. For women/wives, the largest decline was for Filipinos and Koreans.
The only exceptions to this trend of declining rates of White-Asian marriages were for Asian Indian women/wives (whose rate slightly increased from 2006 to 2010) and for both Vietnamese men/husbands and women/wives. For Vietnamese men, their rates of having a White wife increased from 15.0% to 21.9% while for Vietnamese women, their rate for having a White husband jumped from 28.3% to 41.3%.
Strangely, the population sizes for U.S.-raised married Vietnamese American men and women declined from 2006 to 2010. For example, in 2006, there were about 40,500 and 45,200 U.S.-raised Vietnamese men and women respectively who were married. In 2010, those numbers declined to 26,795 and 34,998. Some possible explanations are that many who were married in 2006 got divorced, U.S.-raised Vietnamese men and women are delaying getting married, and/or many U.S.-raised Vietnamese have changed their ethnic identity to some other ethnic group, such as Chinese or Hmong.
In contrast to the declining rates of Asian-White marriages, the rates for Pan-Asian/Other Asian marriages have increased notably from 2006 to 2010 (having a spouse of a different Asian ethnicity). This increase was almost universal across all the six ethnic groups and for both genders (the only exception was for Filipino women). Among U.S.-raised men/husbands, Vietnamese Americans experienced the biggest increases in having a pan-Asian spouse — from 5.8% in 2006 to 13.7% in 2010 for men and from 7.8% to 12.2% for women/wives.
Here are some more announcements, links, and job postings about academic-related jobs, fellowships, and other related opportunities for those interested in racial/ethnic/diversity issues. As always, the announcements and links are provided for informational purposes and do not necessarily imply an endorsement of the organization or college involved.
Call for Participants: BBC Documentary on Viet Nam War
Dear Sir,
I am a BBC journalist writing from London. I work on a history programme called “Witness”, which focuses on significant events in the recent past. The hundreds of subjects that we have looked at have included the trial of Nelson Mandela, the bombing of Hiroshima and the beginnings of the civil rights movement in America — to name just a few. Our programme is broadcast to a large audience around the world.
And in the weeks ahead we very much hope to focus on the stories of those who fled Vietnam by boat at the end of the war there in the 1970s. We are simply looking for interviewees who might be willing to tell us — in quite strong English — what they went through. I realise that, for some, remembering such traumatic events this will not be at all easy. But we would like to be able to remind our listeners around the world what the Vietnamese boat people endured. We want to record their story for our archive.
Would you, I wonder, be able to put me in touch figures in the Vietnamese refugee community who might be able to help in our search for interviewees? They can contact me through my email below.
The Japanese American Citizens League (JACL) is kicking off its Scholarship Program for the 2011 academic year. At the national level, JACL offers over 30 awards, with an annual total of over $60,000 in scholarships.
JACL Membership, which is required for applications, is open to anyone of any ethnic group. Membership dues can be paid online or with the application. The 2011 National JACL Scholarship Program informational brochure and applications are posted on the JACL website.
JACL Scholarship applications for Undergraduate, Graduate, Law, Creative & Performing Arts, and Financial Aid. The deadline for these applications is April 1, 2011. These are to be sent directly by the applicants to: National JACL Scholarship Program, c/o Portland JACL, P.O. Box 86310, Portland, OR 97286.
For additional information regarding the JACL National Scholarship Program, please contact Patty Wada at (415) 345-1075 or ncwnp@jacl.org.
Youth Justice Leadership Institute Seeks Applicants for 2011-2012 Program Year
The National Juvenile Justice Network seeks applicants for the pilot year of its Youth Justice Leadership Institute. The Institute’s mission is to create the foundation for a more effective juvenile justice reform movement by developing a strong base of well prepared and well trained advocates and organizers who reflect the communities most affected by juvenile justice system practices and policies.
The Institute’s inaugural year will focus on cultivating and supporting professionals of color. The Institute is a robust, year long program that includes leadership development, training in juvenile justice system policies and practices, and advocacy skills development. The Institute will bring fellows together twice during the year, attach each fellow to a mentor and envelope fellows within the larger juvenile justice reform community.
If you are a professional of color and are interested in applying for the Institute, please visit our web site to download our application packet or contact the Institute’s Coordinator, Diana Onley-Campbell, at diana@juvjustice.org. Applications are due on April 26, 2011.
The “Chinese shop†in all its manifestations (laundry, bakery, restaurant, general store, etc.) has been integrally connected to Chinese migration and the experience of overseas Chinese. Indeed, the Chinese shop has been both a site of economic and symbolic exchange – a complex locus of power and performative societal tensions and identifications. As such, the consideration of Chinese shop space provides an intriguing staring point from which to investigate many key socio-political issues for Chinese diasporic communities.
Hosted at Ryerson University in Toronto, Ontario, Canada, this conference aims to bring together an interdisciplinary group of scholars to investigate how the space and place of the Chinese shop (broadly defined) has been conceived of and experienced for overseas Chinese. In particular, it seeks to explore the transformative socio-cultural, economic and political processes that create the space and place of the Chinese shop both within Chinese diasporic communities and in terms of encounters between the Chinese and their host societies.
We encourage panels and papers with diverse disciplinary approaches to this theme, including those that consider the Chinese shop within transnational, hemispheric and/or comparative contexts. Topics might include, but are not limited to the following:
The representation and imagination of shop space
The political contestations and designations of shop space
Theoretical deliberations on the spatial dimensions of the Chinese shop
The shop as gendered space
The shop as racialized space
The historical, social and economic implications of the Chinese shop
The impact of nationalism, globalization, colonialism, and/or imperialism on Chinese shop space
The deadline for abstracts is Friday, April 29th, 2011. Abstracts and CVs can be submitted online by clicking on the “Submit Abstracts” link in the menu on the right-hand side of the page. Additional questions can be addressed to Dr. Anne-Marie Lee-Loy at: aleeloy@ryerson.ca.
A scholarship fund has been established in honor of Warren E. Miller for participation in the Inter-university Consortium for Political and Social Research (ICPSR) 2011 Summer Program in Quantitative Methods of Social Research. Professor Miller was not only one of the most prominent figures in modern social science research. He was also the founder of both ICPSR and the ICPSR Summer Program.
The Warren E. Miller Scholarship Fund will provide financial support to outstanding pre-tenure scholars (assistant professors and advanced graduate students) in the social and behavioral sciences so they may attend one or both of the four-week sessions in the 2011 ICPSR Summer Program. Recipients of the Miller Scholarship will receive a fee waiver to cover Program enrollment and a stipend to help with expenses while staying in Ann Arbor. Applicants to the Warren E. Miller Scholarship should have professional interests in one or more of the following areas of research (or in related fields):
Developing a common approach to understanding electoral behavior within or across nations
Understanding the process of democratization in electoral systems
Understanding the link between global politics and local electoral behavior
Understanding how context influences political behavior
Understanding how globalization causes change in political behavior
Application materials for the Miller Scholarship should be submitted electronically, through the ICPSR Summer Program’s online Portal on the Summer Program’s website. Applicants should register for the 2011 Summer Program using the online form and select classes in one or both of the four-week sessions. Note that course selections may be modified and changed later. But, the Miller Scholarship Committee may use an applicant’s preferred courses as a criterion in the selection process for the scholarship. Along with a completed registration, an application must include:
A current vita
A cover letter from the student, explaining how participation in the ICPSR Summer Program will contribute toward completion of the Ph.D.
Two letters of recommendation. For applicants who are faculty members, one of these letters should come from his or her Department Chair. For graduate student applicants, one of the letters should come from his or her faculty advisor or dissertation chairperson. Letters of recommendation should be e-mailed directly to sumprog@icpsr.umich.edu. Letter writers should include “MILLER SCHOLARSHIP RECOMMENDATION†and the applicant’s name in the subject line of the e-mail message.
The application deadline for the Warren E. Miller Scholarship is April 29, 2011. Further information about the ICPSR Summer Program, including course descriptions and the 2011 schedule, is available on the Program website. Also, you should feel free to contact the ICPSR Summer Program by e-mail (sumprog@icpsr.umich.edu) or by telephone (734-763-7400) if you have any questions.
Call for Papers: Critical Refugee Studies
Conference on Critical Refugee Studies
University of Wisconsin-Milwaukee
November 3-4, 2011
Displacement of populations affects the uprooted as well as communities that receive them. Recognized by international proxy after World War II, the identity category of refugee has a history as long as the incidence of warfare and other crises that result in displacement. This conference uses the 20th century invention of the category of refugee as a means to compare the experiences of displaced persons across time and space.
We invite papers that chronicle and reflect on the experiences and representations of refugee populations. In particular, we are interested in work that expands the idea of the refugee to create comparisons and parallels with the experiences of other groups. Papers that define the term refugee broadly and creatively are most welcome. Among the questions we invite:
How do refugee identities compare to those of other migrants?
As local and global political contexts change, how do refugees conceptualize notions of citizenship and home?
How are refugee identities in dialogue with concepts of place/displacement?
What is the role of memory and the creation of refugee texts?
How is the refugee experience mediated/mass mediated?
Abstracts by May 15, 2011 to: criticalrefugee-studies@uwm.edu.
Speakers:
Michael Rios, Director, Sacramento Diasporas Project, University of California-Davis
Romola Sanyal, Lecturer in Global Urbanism, Newcastle University
Ghita Schwarz, New York Legal Aid, Author, Displaced Persons
Shirley Tang, Asian American/American Studies University of Massachusetts, Boston
Dinaw Mengestu, Author, The Beautiful Things that Heaven Bears; How to Read the Air (To Be Confirmed)
Call for Papers: Disability in Asian America
Amerasia Journal Special Issue Call for Papers: The State of Illness and Disability in Asian America
Guest Editors: Professor Jennifer Ho (University of North Carolina, Chapel Hill) and Professor James Kyung-Jin Lee (University of California, Irvine)
We seek critical essays and articles as well as creative non-fiction and first-person accounts that engage with the intersections of Asian American discourse and illness/disability studies, for a special issue of Amerasia Journal, scheduled for publication in 2012.
Since, as scholar Michael Berube observes, “the definition of disability, like the definition of illness, is inevitably a matter of social debate and social construction,” we are interested in how these social constructions of disability and illness coincide, collide, and converge with those of ethnicity and race, along with other axes of intersectionality such as gender, sexuality, class, region, religion, age, and education.
Critiquing the narrow perspective of the discipline, scholar Chris Bell has noted “the failure of Disability Studies to engage issues of race and ethnicity in a substantive capacity, thereby entrenching whiteness as its constitutive underpinning.” One goal of this special issue is to provide another forum in which to challenge entrenched whiteness within Disability and Illness Studies as well as to bring to the foreground the state of illness and disability within the Asian American community. Contributors to this special issue may consider the following questions:
What is the role of illness and disability within Asian American narratives—be they in fiction, non-fiction, or cinematic form—and/or how is the ill or disabled Asian American body represented within these narratives?
How are illness and disability regarded within Asian American communities and cultural productions?
What are the special needs of Asian Americans who face life threatening and chronic illnesses?
What kinds of accommodations do Asian Americans with disabilities find most challenging in light of their ethnic and cultural backgrounds and/or as a result of their racialization as non-white Americans?
How might Asian American experiences of disability and/or illness invite a reimagination of what constitutes a “good” life practice or way of living, and what kinds of social transformations would be necessary to make this so?
Submission Guidelines and Deadlines:
Due Date for one-page abstracts: June 15, 2011. Due Date for solicited final papers: January 2012. Publication Date: Fall 2012. The editorial procedure involves a three-step process: The guest editors, in consultation with the Amerasia Journal editors and peer reviewers, make decisions on the final essays:
1. Approval of abstracts
2. Submission of papers solicited from accepted abstracts
3. Revision of accepted peer-reviewed papers and final submission
Please send correspondence regarding the special issue on illness and disabilities studies in Asian American Studies to the following addresses. All correspondence should refer to “Amerasia Journal Disabilities Studies Issue” in the subject line.
Professor Jennifer Ho: jho@email.unc.edu
Professor James Kyung-Jin Lee: jkl@uci.edu
Arnold Pan, Amerasia Journal: arnoldpan@ucla.edu
Call for Papers: Mixed-Status Immigrant Families
“In Between the Shadows of Citizenship: Mixed Status Families”
Guest Editors: Mary Romero, Professor, Arizona State University, Justice and Social Inquiry and Jodie Lawston, Assistant Professor, California State University San Marcos, Women’s Studies
Despite the fact that immigration stories are increasingly featured in U.S. popular media discourse and an immigrant justice movement continues to strengthen, little scholarship has focused on the experiences of immigrants and their families, and especially, families who are mixed status in that they are comprised of both citizens and noncitizens. This edited volume aims to examine the experiences of immigrants and mixed status families in terms of work and education, raids, deportations, and detention, and resistance toward anti-immigrant sentiment. We welcome and encourage work that examines not just the experiences of immigrants in the U.S., but the experiences of immigrants around the globe.
The questions we are interested in exploring include but are not restricted to the following: What forms of work do immigrant women engage in to support their families? What are the struggles of undocumented students? How do raids, deportations, and detention affect families? How do such phenomena affect mixed status families? What are the experiences of immigrants, particularly women and children, in detention? How have changes in laws affected undocumented immigrants and their children? What strategies have justice movements used to protect undocumented men, women, and children? How are countries around the world approaching immigration and undocumented immigration, and how does that compare to U.S. policies? We seek explorations and answers to these questions that engage notions of gender, race and ethnicity, place, and culture as well as documentation and analysis of leadership and activism.
The following topical areas broadly outline the subject matter that we see as most relevant to this volume. These can be used as starting points for papers, but authors are not restricted to them:
The effects of detention on immigrant families, particularly in separating those families
The impact of family reunification
The intersection of work and immigration status
The effects of immigration status on students
The effects of raids and/or deportations on families
Changes in laws and resulting effects on immigrants’ lives
Immigrant justice work
Comparative studies of issues related to immigration in different parts of the world
The intersections of race, class, gender, and with immigration status
We are interested in both academic papers and testimonies from immigrant women on the above topics.
Submission Process: Proposals for academic papers or testimonies, no longer than three pages, should be emailed to Jodie Lawston at jlawston@csusm.edu by Wed. June 15, 2011. Author(s) must include all identifying information on the proposal, including name, title, institutional affiliation, address, phone numbers, and email. After the deadline, we will review proposals and contact authors as to which manuscripts we are interested in reviewing for the book. Proposals must include the subject matter of the paper, methods used for your analysis, and the argument you plan to make based on your data.
Here are some more announcements, links, and job postings about academic-related jobs, fellowships, and other related opportunities for those interested in racial/ethnic/diversity issues. As always, the announcements and links are provided for informational purposes and do not necessarily imply an endorsement of the organization or college involved.
Are you bilingual in Vietnamese and English? Are you looking for positions that pays $17.00 an hour or more? Superior Court of Orange County is now accepting applications from candidates that are Bilingual in Vietnamese and English.
The Court has numerous full-time positions and some part-time positions that serve the public and/or work in a call center environment that utilize bilingual skills. Qualified candidates will earn an additional $0.58 or $1.15 an hour on top of the hourly base pay for meeting our bilingual requirements. Current needs are in Laguna Hills; however, we also have work locations in Westminster, Santa Ana, Newport Beach, Fullerton, Irvine, and Orange.
For more information about the positions and how to apply, visit our website.
The Department of English, Hawai’i Pacific University, invites applications for 1 full-time, career-track (in lieu of a tenure system, HPU uses a “career-track” system consisting of 5 years of renewable reappointments (two 1-year and a 3-year contract) culminating in “career” status consisting of a series of 5-year contracts) faculty position at the rank of Assistant Professor for a nine-month appointment to begin Fall 2011. We are seeking applicants with a background in film/media studies or world literature. The successful applicant will be expected to teach a combination of 24 credits (typically 8 classes) of courses in first-year composition; general education, literature, film/media studies, and/or cultural studies; and upper-division English courses in the candidate’s area of specialty. Development of upper-level courses related to area of expertise is also expected as is participation in University and community service.
Minimum qualifications: Candidates for the position should have a Ph.D. in English. ABD will be considered if degree can be completed within first year of appointment. Desired qualifications: Evidence of successful teaching in composition and literature, media studies, or culture studies preferred. The successful applicant must also demonstrate a sincere interest and ability in undergraduate teaching in a multicultural environment, a promising record of scholarship, and an interest in faculty/student extracurricular activities and program review.
To Apply: Applicants should apply online. Supporting documents such as curriculum vitae, three letters of reference, a statement of teaching philosophy, evidence of teaching experience, and description of professional development goals may be submitted electronically as Word or PDF files put together in a ZIP file named with the last name and position number (ex: Jones ####) and e-mailed to HR@hpu.edu. Paper submissions of supporting documents are also accepted at Human Resources: Hawai‘i Pacific University HR Department; 1132 Bishop Street, Suite 310; Honolulu, HI 96813. E-mail: hr@hpu.edu. FAX: 808-544-1192. Review of applications may begin on March 15, 2011.
Department Contact address: Dr. Laurie Leach, 808-544-1103.
The Leadership Conference on Civil and Human Rights (The Leadership Conference) is the leading coalition of organizations committed to civil and human rights in the United States and The Leadership Conference Education Fund is the major research and education organization supporting the coalition. We are seeking applicants for the position of field manager with a background in social media organizing, among other qualifications. It’s a great opportunity to work on multiple civil and human rights issues with a diverse range of groups and communities, nationally and at the state and local level.
Description
The Field Manager will be responsible for a variety of tasks within the Department of Field Operations (DFO). The employee in this position will report to the Vice President, Field Operations, with guidance from the Deputy Field Director(s).
Skills and Qualifications
The job requires a commitment to civil and human rights; organizing and outreach experience; a demonstrated ability to manage multiple tasks; planning and coordinating skills; excellent interpersonal skills; and the ability to work in a fast-paced environment and adhere to deadlines. Minimum requirements are a Bachelors degree; a minimum of three years of field/grassroots experience, preferably with a focus on the creation of materials and tools designed for community leaders and grassroots campaigns; and a demonstrated understanding of and proficiency in the use of social media and web activism software, and Microsoft applications.
Excellent writing and verbal skills, particularly as related to drafting and creating field materials and tools; desire and ability to work with diverse groups of people; desire and ability to manage a complex, ever-changing workload; ability to organize time efficiently; ability to work with intra-departmental teams, interns, and community leaders; and a high level of personal energy and commitment to civil and human rights are essential. Hill experience not required, however a plus.
This is a mid-level position at the center of the organizations’ major work. The employee will have the opportunity to work with the DFO to participate in and/or lead field campaigns to activate the grassroots on critical civil and human rights issues. The employee will play a key role in developing and advancing grassroots strategy on the major priority issues of The Leadership Conference. S/he will also be exposed to the most broad-based civil and human rights coalition in the country, and to participatory democracy at its best.
Duties and Responsibilities
Work directly with the Vice President for Field Operations and field team to:
Envision and draft materials, alerts and tools for grassroots activists, community leaders, and the civil and human rights coalition as the DFO develops field campaigns on priority Leadership Conference issues
Work with the field team to devise a strategy around components of online activism, such as Internet action alerts, social networking systems and innovative web-based outreach
Serve as DFO representative on the intra-departmental Online Strategy Group
Devise grassroots outreach and activation strategies on organizational priority issues, with a particularized focus on developing written materials and social media tools for national, state, and local partners’ use
Plan, manage and maintain effective technical support for members of the coalition in their efforts to activate the grassroots and for state and local partner organizations as they implement grassroots campaigns
Drive and monitor the development of field outreach, public education, and capacity campaigns in a set of key states as they relate to the organizations’ priority issues and areas of focus
Work with the DFO to develop grassroots coalitions in key states and to organize national grassroots task force meetings
Participate in department, All-Staff, team, and other meetings as needed
Salary and Benefits
This is a mid-level position with a starting salary in the mid forties.
To Apply
Send resume and cover letter, by March 31, 2011, via email to personnel@civilrights.org with Field Manager in the subject line; fax to (202) 466-3435, or mail to:
The Leadership Conference /The Leadership Conference Education Fund
1629 K Street, N.W., 10th Floor
Washington, D.C. 20006
Attention: Field Manager Search
No telephone inquiries, please.
Reality Show Call for Participants: Asian American Families
We have been commissioned by the BBC to make a programme on family values and parenting in different nations and cultures all over the world. We are now in the 4th series of this very popular programme but have yet to represent a family of Asian origin – and would very much like to do so in the States in the coming weeks.
We are reaching out to families ( with teens) and are hoping that a loving, but disciplined family will be interested in participating in the series whereby they ‘host’ 2 British teenagers for a week, instilling in them the values and morality they demand of their own children. This very popular programme has already met and filmed inspirational families in countries ranging from South Africa to India, US to Lebanon.
If you know of any families who are interested in participating, you can contact me at my email below.
I am a doctoral candidate from the Department of Counseling and Human Development Services at the University of Georgia under the direction of Dr. Brian Glaser. I invite you to participate in a research study entitled “A Study of Scale Construction in the Asian American/Pacific Islander Population”. The purpose of this study is to investigate the values system within the Asian American/ Pacific Islanders (AAPI) population in order to create a scale that accurately quantifies these values.
You are invited to participate in a study investigating value systems in the Asian-American/Pacific Islander (AAPI) population. Any self-identified AAPI or with AAPI heritage, ages 18 and over, are welcome to participate. If you agree to participate, you will be asked to answer a series of question reflecting your values system as part of a larger study to create a measurement scale. Your answers will remain anonymous.
The scale consists of 46 items and will take approximately 5-20 minutes to complete. By taking part in this study, your responses may help improve the conceptualization and treatment of AAPI clients in therapy. If you have any questions or concerns, please refer to the informational letter for further contact information. Your help is greatly appreciated.
Thank you,
Pearl S. Chang, M.Ed., M.A.
University of Georgia
pearl1@uga.edu
Research Supervisor:
Brian Glaser, Ph.D.
bglaser@uga.edu
The Asian American Studies Program at Hunter College (AASP), The City University of New York, currently seeks candidates to develop and teach Asian American Studies courses primarily in the Social Sciences, e.g. Psychology, Political Science, History, Sociology, Human Rights, Economics, etc. In addition, we also seek candidates to develop and teach Asian American Studies courses in Education, Journalism/Media Studies/Communication, and Public Health. Applicants must have at least an M.A. or ABD in a relevant field, as well as a record of successful undergraduate teaching.
About the Program
The Asian American Studies Program (AASP) at Hunter College was founded in 1993 on the initiative of students and faculty. Today, we are a small but dynamic program with a growing number of minors, and we offer approximately 12 courses per semester, ranging from our interdisciplinary survey courses to more advanced courses in Literature, Cultural Studies, and Diasporic community formations — West Asian American, Chinese American, and Korean American in particular. Located in the heart of New York City, the AASP works closely with Asian American organizations to build and sustain ties to local communities and concerns. Affiliated full-time faculty in the College are located in areas as diverse as Urban Studies, Film and Media, Sociology, English, and Dance.
Teaching at Hunter
Applicants should be prepared to teach their classe(es) to a cross-section of undergraduate students from all majors. The majority of our courses are taught by adjunct faculty: as a result the work you will do in our program is crucial to the process of introducing undergraduates to concepts concerning Asian American history and experience. We hope to work with dedicated, effective, and intelligent educators, and we seek to provide a welcoming and supportive work environment for our faculty.
Please email the following documents to: jennifer.hayashida@hunter.cuny.edu
CV
Letter of Intent
Brief Pedagogical Statement outlining your teaching philosophy
Contact information for at least 3 references
Jennifer Hayashida, Acting Director
Asian American Studies Program
Hunter College, CUNY
695 Park Avenue, Room 1037HE
New York, NY 10065
Hello! I am the publisher of MySavvySisters.com a website dedicated to empowering women. I want all races to be represented on our website and I would love for you to pass along the names of any outstanding women that you know of who are enjoying their lives or careers. I would love to profile them and introduce them to our readers.
Please feel free to check out our site with tips on women I can profile.
To commemorate and celebrate the contributions to our nation made by people of African descent, American historian Carter G. Woodson established Black History Week. The first celebration occurred on Feb. 12, 1926. For many years, the second week of February was set aside for this celebration to coincide with the birthdays of abolitionist/editor Frederick Douglass and Abraham Lincoln. In 1976, as part of the nation’s bicentennial, the week was expanded into Black History Month. Each year, U.S. presidents proclaim February as National African-American History Month.
41.8 million
As of July 1, 2009, the estimated population of black residents in the United States, including those of more than one race. They made up 13.6 percent of the total U.S. population. This figure represents an increase of more than a half-million residents from one year earlier.
38%
Percentage of Mississippi’s population that was black in 2009. Although New York had the largest number of blacks of any state, Mississippi had the largest share of blacks in its total population. Blacks also made up more than a quarter of the population in Louisiana (33%), Georgia (31%), Maryland (31%), South Carolina (29%) and Alabama (27%). They comprised 55% of the population in the District of Columbia.
19%
Percentage of blacks 25 and older who had a bachelor’s degree or higher in 2009.
11.5 million
Among blacks 25 and older, the number who had an advanced degree in 2009 (e.g., master’s, doctorate, medical or law). A decade earlier, in 1999, about 900,000 blacks had this level of education.
2.5 million
Number of black college students in fall 2008. This was roughly double the corresponding number from 25 years earlier.
55%
Turnout rate in the 2008 presidential election for the 18- to 24-year-old citizen black population, an 8 percent increase from 2004. Blacks had the highest turnout rate in this age group.
65%
Turnout rate among black citizens in the 2008 presidential election, up about 5 percentage points from 2004. Looking at voter turnout by race and Hispanic origin, non-Hispanic whites and blacks had the highest turnout levels.
$32,584
The annual median income of single-race black households in 2009, a decline of 4.4 percent (in 2009 constant dollars) from 2008.
28%
The percentage of single-race blacks 16 and older who worked in management, professional and related occupations.
$137.4 billion
Receipts for black-owned businesses in 2007, up 55.1 percent from 2002. The number of black-owned businesses totaled 1.9 million in 2007, up 60.5 percent.
Did you know that November is American Indian & Alaskan Native Heritage Month? Asian Americans share much in common with our Native American Indian and Alaskan brothers and sisters, not just in terms of social and cultural solidarity, but also similar anthropological ancestors as well. To celebrate their heritage, the U.S. Census Bureau has some a fact sheet with some interesting statistics:
The first American Indian Day was celebrated in May 1916 in New York. Red Fox James, a Blackfeet Indian, rode horseback from state to state, getting endorsements from 24 state governments, to have a day to honor American Indians. In 1990, President George H.W. Bush signed a joint congressional resolution designating November 1990 as “National American Indian Heritage Month.”
4.9 million
As of July 1, 2008, the estimated population of American Indians and Alaska Natives, including those of more than one race. They made up 1.6 percent of the total population.
29.7
Median age of the American Indian and Alaska Native population in 2008, younger than the median of 36.8 for the population as a whole. About 30 percent of American Indians and Alaska Natives were younger than 18, and 8 percent were 65 and older.
5
Number of states where American Indians and Alaska Natives were the largest race or ethnic minority group in 2008. These states are Alaska, Montana, North Dakota, Oklahoma and South Dakota.
18%
The proportion of Alaska’s population identified as American Indian and Alaska Native as of July 1, 2008, the highest rate for this race group of any state. Alaska was followed by Oklahoma (11 percent) and New Mexico (11 percent).
29%
Percentage of American Indians and Alaska Natives 5 and older who spoke a language other than English at home.
$37,815
The median income of households from the 2008 American Community Survey where the householder reported being American Indian and Alaska Native and no other race.
24.2%
The 2008 poverty rate of people who reported they were American Indian and Alaska Native and no other race.
$26.9 billion
Receipts for American Indian- and Alaska Native-owned businesses in 2002. These businesses numbered 201,387.
In addition, the Association of College & Research Libraries has also compiled a very useful list of internet sites and resources related to the Native American Indian population and their history, contributions, and experiences. Below are a few of the websites that I found particularly interesting:
September 15 through October 15 is Hispanic Heritage Month. Below is an historical summary and a few noteworthy statistics published by the Census Bureau for this occasion:
In September 1968, Congress authorized President Lyndon B. Johnson to proclaim National Hispanic Heritage Week, which was observed during the week that included Sept. 15 and Sept. 16. The observance was expanded in 1988 to a month-long celebration (Sept. 15 – Oct. 15). America celebrates the culture and traditions of those who trace their roots to Spain, Mexico and the Spanish-speaking nations of Central America, South America and the Caribbean.
Sept. 15 was chosen as the starting point for the celebration because it is the anniversary of independence of five Latin American countries: Costa Rica, El Salvador, Guatemala, Honduras and Nicaragua. In addition, Mexico and Chile celebrate their independence days on Sept. 16 and Sept. 18, respectively.
48.4 million
The estimated Hispanic population of the United States as of July 1, 2009, making people of Hispanic origin the nation’s largest ethnic or race minority. Hispanics constituted 16 percent of the nation’s total population. In addition, there are approximately 4 million residents of Puerto Rico, a Caribbean U.S. territory.
3.1%
Percentage increase in the Hispanic population between July 1, 2008, and July 1, 2009, making Hispanics the fastest-growing minority group.
22.4 million
The nation’s Hispanic population during the 1990 Census.
132.8 million
The projected Hispanic population of the United States on July 1, 2050. According to this projection, Hispanics will constitute 30 percent of the nation’s population by that date.
66%
The percentage of Hispanic-origin people in the United States who were of Mexican background in 2008. Another 9 percent were of Puerto Rican background, with 3.4 percent Cuban, 3.4 percent Salvadoran and 2.8 percent Dominican. The remainder was of some other Central American, South American or other Hispanic or Latino origin.
27.4 years
Median age of the Hispanic population in 2009. This compared with 36.8 years for the population as a whole.
107
Number of Hispanic males in 2009 per every 100 Hispanic females. This was in sharp contrast to the overall population, which had 97 males per every 100 females.
47%
The percentage of the Hispanic-origin population that lived in California or Texas in 2009. California was home to 13.7 million Hispanics, and Texas was home to 9.1 million.
46%
The percentage of New Mexico’s population that was Hispanic in 2009, the highest of any state (New Mexico had 916,000 Hispanics). Hispanics also made up at least one fifth of the population in California and Texas, at 37 percent each, followed by Arizona (31 percent), Nevada (26 percent), Florida (22 percent) and Colorado (20 percent).
50
Number of the nation’s 3,143 counties that were majority-Hispanic.
2.3 million
The number of Hispanic-owned businesses in 2007, up 43.6 percent from 2002.
$345.2 billion
Receipts generated by Hispanic-owned businesses in 2007, up 55.5 percent from 2002.
35 million
The number of U.S. residents 5 and older who spoke Spanish at home in 2008. Those who hablan español constituted 12 percent of U.S. residents. More than half of these Spanish speakers spoke English “very well.”
4
The number of Hispanic surnames ranked among the 15 most common in 2000. It was the first time that a Hispanic surname reached the top 15 during a census. Garcia was the most frequent Hispanic surname, occurring 858,289 times and placing eighth on the list — up from 18th in 1990. Rodriguez (ninth), Martinez (11th) and Hernandez (15th) were the next most common Hispanic surnames.
This post doesn’t focus on Asian Americans or racial/ethnic issues specifically but is certainly relevant to those kinds of discussion since it deals with what aggregate-level statistics can tell us about a person’s day-to-day life.
During this current economic recession, many of us are very aware of how it has affected our lives and perhaps the lives of those close to us. But beyond the grim stats about rising unemployment numbers that we hear on the news, what is the aggregate effect of the recession on Americans as a collective group? For many sociology students, this question might be rephrased as, “What can aggregate-level data tell us about individual lives?”
To try to answer that question, the Census Bureau has just released a report that describes how the recession has led Americans to make changes in many areas of their lives:
Preliminary data earlier this year found that many Americans were not moving, staying put in big cities rather than migrating to the Sunbelt because of frozen lines of credit. Mobility is at a 60-year low, upending population trends ahead of the 2010 census. . . . The percentage of people who drove alone to work dropped last year to 75.5 percent, the lowest in a decade, as commuters grew weary of paying close to $4 a gallon for gasoline and opted to carpool or take public transportation. . . .
Average commute times edged up to 25.5 minutes, erasing years of decreases to stand at the level of 2000, as people had to leave home earlier in the morning to pick up friends for their ride to work or to catch a bus or subway train. . . . Average commute times edged up to 25.5 minutes, erasing years of decreases to stand at the level of 2000, as people had to leave home earlier in the morning to pick up friends for their ride to work or to catch a bus or subway train. . . .
Nearly 1 in 3 Americans 15 and over, or 31.2 percent, reported they had never been married, the highest level in a decade. . . . Sociologists say younger people are taking longer to reach economic independence and consider marriage because they are struggling to find work or focusing on an advanced education. . . .
The homeownership rate fell to 66.6 percent last year, the lowest in six years, after hitting a peak of 67.3 percent in 2006. Residents in crowded housing jumped to 1.1 percent, the highest since 2004, a sign people were “doubling up” with relatives or friends to save money. . . .
More people are getting high school diplomas. Only two states, Texas and Mississippi, had at least 1 in 5 adults without high school diplomas. This is down from 17 states in 2000 and 37 in 1990. More older people are working. About 15.5 percent of Americans 65 and over, or 6.1 million, were in the labor force. That’s up from 15 percent in 2007.
It is probably no surprise that the recession has led many Americans to put off big life-changing events such as moving far away, getting married, or buying a house, along with smaller-scale changes such as driving alone less, more carpooling, sharing apartments, or working later in life. Many of us can relate to many of these changes ourselves.
What may be surprising is that aggregate-level data and statistics like this can capture such individual-level behavior and therefore give us a more fuller picture of how institutional events like an economic recession eventually affect the day-to-day lives of Americans on the aggregate level.
My point is that data like this are a nice example of how aggregate-level statistics help us understand individual-level actions. It’s with that in mind that I again urge everyone to complete and return the Census forms that will be sent out in a few months.
As the Census Bureau ramps up its efforts toward the 2010 census, they’ve just released a summary sheet from their recently published State and County report that highlights some interesting geographic characteristics of the racial/ethnic minority population in the U.S.:
Four states were majority-minority in 2008: Hawaii (75%), New Mexico (58%), California (58%) and Texas (53%). The District of Columbia was 67% minority. No other state had more than a 43% minority population. . . .
Hispanics
California had the largest Hispanic population of any state in July 2008 (13.5 million), as well as the largest numeric increase within the Hispanic population since July 2007 (313,000). New Mexico had the highest percentage of Hispanics at 45%.
Los Angeles County, Calif., had the largest Hispanic population of any county (4.7 million) in 2008 and the largest numeric increase since 2007 (67,000). Starr County — on the Mexican border in southern Texas — had the highest share of Hispanics (97%).
There were 48 majority-Hispanic counties nationally; the top 10 were all in Texas.
Blacks
New York had the largest Black population of any state as of July 1, 2008 (3.5 million); Georgia had the largest numeric increase since July 1, 2007 (67,000). The District of Columbia had the highest percentage of Blacks (56%), followed by Mississippi (38%).
Cook County, Ill. (Chicago) had the largest Black population of any county (1.4 million), and Orleans Parish, La. (New Orleans) had the largest numeric increase since July 1, 2007 (16,000). Claiborne County, Miss. — on the Louisiana border — had the highest percentage of Blacks in the nation (84%).
Seventy-seven counties were majority-Black or African-American; all were in the South.
Asians
California had both the largest Asian population of any state (5.1 million) in July 2008 and the largest numeric increase of Asians since July 2007 (105,000). Hawaii is our nation’s only majority-Asian state, with people of this group comprising 54% of the total population.
Los Angeles County, Calif., had the largest Asian population of any county (1.4 million) in July 2008. Santa Clara County, Calif. (San Jose) had the largest numeric increase (19,000) since July 2007. At 58%, Honolulu County, Hawaii, was the only majority-Asian county in the nation.
Overall, the Census Bureau also estimates that as of 2008, the Asian American population stood at 15,480,349 (13,549,064 of whom are monoracial Asian) and Asian Americans comprise 5.1% of the total U.S. population of 304,059,724.
To commemorate and celebrate the contributions to our nation made by people of African descent, American historian Carter G. Woodson established Black History Week. The first celebration occurred on Feb. 12, 1926. For many years, the second week of February was set aside for this celebration to coincide with the birthdays of abolitionist/editor Frederick Douglass and Abraham Lincoln. In 1976, as part of the nation’s bicentennial, the week was expanded into Black History Month. Each year, U. S. presidents proclaim February as National African-American History Month.
40.7 million
As of July 1, 2007, the estimated population of black residents in the United States, including those of more than one race. They made up 13.5 percent of the total U.S. population.
65.7 million
The projected black population of the United States (including those of more than one race) for July 1, 2050. On that date, according to the projection, blacks would constitute 15 percent of the nation’s total population.
38%
Percentage of Mississippi’s population that is black, highest of any state. Blacks also make up more than a quarter of the population in Louisiana (32%), Georgia (31%), Maryland (30%), South Carolina (29%) and Alabama (27%). They comprise 56% of the population in the District of Columbia.
2.4 million
Number of single-race black military veterans in the United States in 2007. More military veterans are black than any other minority group.
19%
Percentage of single-race blacks 25 and older who had a bachelor’s degree or higher in 2007.
1.2 million
Among single-race blacks 25 and older, the number who had an advanced degree in 2007 (e.g., master’s, doctorate, medical or law). In 1997, 717,000 blacks had this level of education.
$88.6 billion
Revenues for black-owned businesses in 2002. The number of black-owned businesses totaled nearly 1.2 million in 2002. Black-owned firms accounted for 5 percent of all non-farm businesses in the United States.
$33,916
The annual median income of single-race black households in 2007, up from $32,876 (in 2007 constant dollars) in 2006.
24.5%
Poverty rate in 2007 for single-race blacks, statistically unchanged from 2006.
64.5%
Percentage of families among households with a single-race black householder. There were 8.5 million black family households.
46%
Nationally, the percentage of households with a householder who is single-race black who lived in owner-occupied homes. The rate was higher in certain states, such as Mississippi, where it reached 59%.
27%
The percentage of single-race blacks 16 and older who work in management, professional and related occupations. There are 49,730 black physicians and surgeons, 70,620 postsecondary teachers, 49,050 lawyers, and 57,720 chief executives.
The first American Indian Day was celebrated in May 1916 in New York. Red Fox James, a Blackfeet Indian, rode horseback from state to state, getting endorsements from 24 state governments, to have a day to honor American Indians. In 1990, President George H.W. Bush signed a joint congressional resolution designating November 1990 as “National American Indian Heritage Month.”
4.5 million
As of July 1, 2007, the estimated population of American Indians and Alaska Natives, including those of more than one race. They made up 1.5% of the total population.
30.3
Median age of the single-race American Indian and Alaska Native population in 2007, younger than the median of 36.6 for the population as a whole. About 27% of American Indians and Alaska Natives were younger than 18, and 8% were 65 and older.
5
Number of states where American Indians and Alaska Natives were the largest race or ethnic minority group in 2007. These states are Alaska, Montana, North Dakota, Oklahoma and South Dakota.
18%
The proportion of Alaska’s population identified as American Indian and Alaska Native as of July 1, 2007, the highest rate for this race group of any state. Alaska was followed by Oklahoma (11%) and New Mexico (10%).
76%
The percentage of American Indians and Alaska Natives 25 and older who had at least a high school diploma. Also, 13% had at least a bachelor’s degree.
25%
The percentage of civilian-employed American Indian and Alaska Native people 16 and older who worked in management, professional and related occupations. In addition, 23 percent worked in sales and office occupations and about the same percentage worked in service occupations.
$35,343
The 2007 median income of households where the householder reported being American Indian and Alaska Native and no other race.
25.3%
The 2007 poverty rate of people who reported they were American Indian and Alaska Native and no other race.