
February 12, 2008
Written by C.N.
Map of Asian American Interracial Couples
Being the keen demographic observer that I am, I noticed that the Census Bureau just released their Atlas of the U.S., a collection of maps that illustrate the geographic distribution of various demographic characteristics of the U.S. population.
Within their chapter on Race and Hispanic Origin, they present one map that I found particularly interesting: the geographic distribution of interracial/interethnic couples in which one is Asian Pacific American. If you click on the map, you can view a larger-size version:
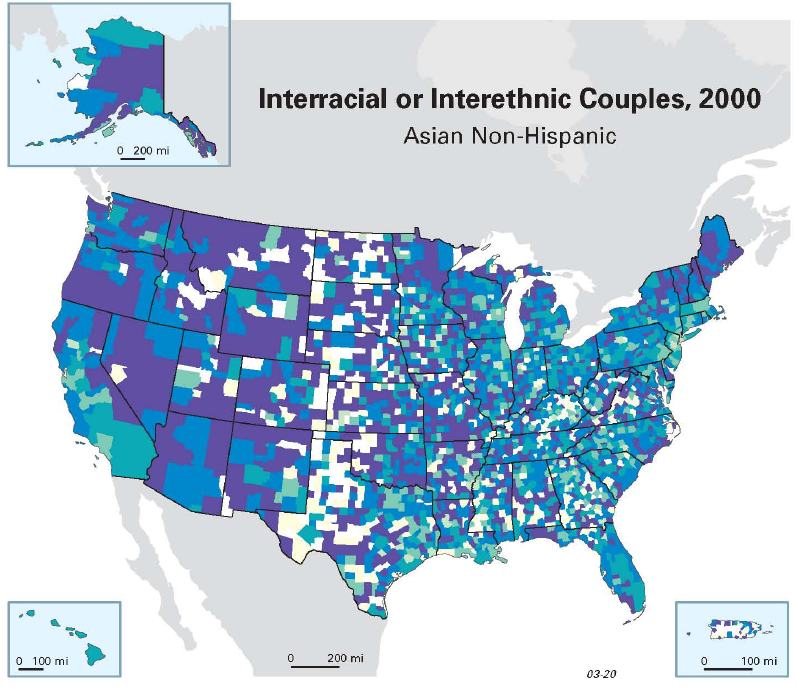
Areas (they’re actually counties) in darker blue represent higher levels of concentration. I point out this map because it illustrates a point that I have consistently made through the years about Asian American interracial marriage that many Asian Americans seem to have a difficult time believing — areas with larger Asian American populations tend to have a lower prevalence of interracial marriages than areas with small Asian American populations.
Specifically, last year over at Jenn Fang’s blog Reappropriate, her readers got into a huge debate about Asian American interracial marriage (that happens often all around the internet, actually), and many of them referenced my statistics that I present on this site.
In trying to explain this phenomenon from a sociological point of view to Jenn’s readers, I wrote, “In large metro areas such as LA/OC, NYC, etc. that contain a large Asian American population, Asian American interracial marriage rates tend to be lower because the pool of potential marriage partners who are Asian American is obviously larger.”
Still, many Asian Americans have a hard time believing that particular point. So for them, I present this map from the Census Bureau as further proof — if you look at the Los Angeles, San Francisco, New York City, Chicago, etc. metropolitan areas, you’ll see that they are colored with lighter shades of blue, indicating lower percentages of all couples in that area that include one Asian American.
Something tells me that this map will not end the debate, but in my mind, it is pretty convincing evidence.
Author Citation
Copyright © 2001- by C.N. Le. Some rights reserved. 
Suggested reference: Le, C.N. . "Map of Asian American Interracial Couples" Asian-Nation: The Landscape of Asian America. <https://www.asian-nation.org/headlines/2008/02/map-of-asian-american-interracial-couples/> ().
Short URL: https://www.asian-nation.org/headlines/?p=551
Translate Into Another Language![]()