The views and opinions expressed on this site and blog posts (excluding comments on blog posts left by others) are entirely my own and do not represent those of any employer or organization with whom I am currently or previously have been associated.
Academic Version: Applying my personal experiences and academic research as a professor of Sociology and Asian American Studies to provide a more complete understanding of political, economic, and cultural issues and current events related to American race relations, and Asia/Asian America in particular.
Plain English: Trying to put my Ph.D. to good use.
You may know that May is Asian Pacific American (APA) Heritage Month. To recognize this occasion, the U.S. Census Bureau has released its annual “Facts for Figures” report that summarizes some interesting demographic facts and data about the APA population. Below are a few interesting data tidbits:
18.9 million
The estimated number of U.S. residents in 2012 who said they were Asian alone or Asian in combination with one or more other races. This group comprised slightly less than 6 percent of the total U.S. population.
46.0%
Percentage growth of the Asian alone or in combination population between the 2000 and 2010 censuses, which was more than any other major race group.
4.2 million
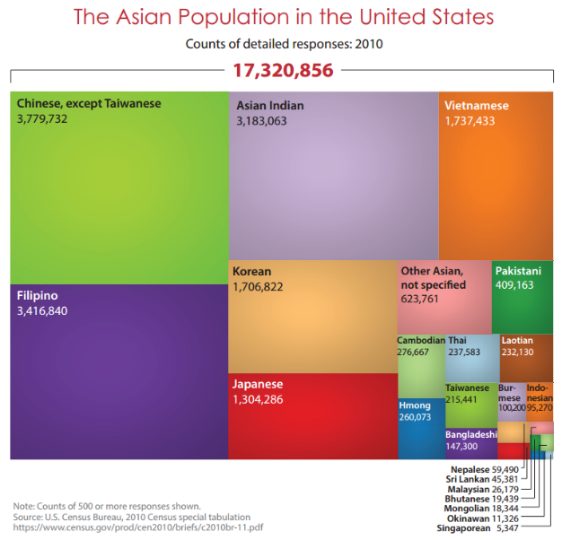
Number of Asians of Chinese, except Taiwanese, descent in the U.S. in 2012. The Chinese (except Taiwanese) population was the largest Asian group, followed by Filipinos (3.6 million), Asian Indians (3.3 million), Vietnamese (1.9 million), Koreans (1.8 million) and Japanese (1.3 million). These estimates represent the number of people who reported a specific detailed Asian group alone, as well as people who reported that detailed Asian group in combination with one or more other detailed Asian groups or another race(s).
$70,644
Median income of households headed by the Asian alone population in 2012. Median household income differed greatly by Asian group. For Asian Indians, for example, the median income in 2012 was $96,782; for Bangladeshi, it was $44,293. (These figures represent the Asian alone population.)
50.5%
The percentage of the Asian alone population 25 and older who had a bachelor’s degree or higher level of education. This compared with 29.1 percent for all Americans 25 and older.
21.2%
The percentage of 25-and-older Asian alone population who had a graduate or professional degree. This compared with 10.9 percent for all Americans 25 and older.
49.1%
The proportion of civilian employed Asian alone population 16 and older who worked in management, business, science and arts occupations, such as financial managers, engineers, teachers and registered nurses in 2012. Additionally, 17.3 percent worked in service occupations, 20.6 percent in sales and office occupations, 9.7 percent in production, transportation and material moving occupations and 3.2 percent in natural resources, construction and maintenance occupations.
88.6%
Percentage of Asian alone population in 2012 living in a household with Internet use — the highest rate among race and ethnic groups.
Here are some more announcements, links, and job postings about academic-related jobs, fellowships, and other opportunities for those interested in racial/ethnic/diversity issues, with a particular focus on Asian Americans. As always, the announcements and links are provided for informational purposes and do not necessarily imply an endorsement of the organization or college involved.
AAPI Nexus Journal: Asian Americans and Pacific Islanders Policy, Practice and Community
Call for Papers: Special Issue on AAPIs and the Environment
AAPI Nexus is pleased to announce a forthcoming special issue that will examine critical theoretical, policy and practical issues related to AAPIs (Asian Americans and Pacific Islanders) and the environment. Despite the tremendous growth in the literature in these two fields, few studies examine their intersection. The goal of the special issue is to fill this gap. For this publication, the environment is broadly defined to include the nexus between people and natural resources (including urban and rural contexts), environmentalism, and environmental justice (e.g., environmental justice movements, policy, organizations, communities, etc). The journal is interested in impacts on Asian Americans and Pacific Islanders, attitudes and opinions, collective action and agency, and studies at the local, regional or state-wide, national and global scales.
AAPI Nexus seeks submissions that as a collection enable the readers to look at issues through multi-disciplinary and comparative lenses. Our objective is to share information and insights to enhance the ability to take action in the areas of advocacy, strategic planning, policy development and programming.
Professor Paul M. Ong (University of California, Los Angeles), Professor Julie Sze (University of California, Davis) and Charles Lee (Deputy Associate Assistant Administrator for Environmental Justice , U.S. Environmental Protection Agency) are the consulting Guest Editors working with the editorial staff on this volume. The following are examples of possible articles:
Cultural influences on environmental attitudes and behavior
Political and civic engagement in the environmental arena broadly defined
Individual and collective action and agency
Differential environmental exposures, risk and impacts (or environmental inequalities)
Differential outcomes from environmental policies and programs
Smart, sustainable and equitable growth
Environmental/Green economy
The list is illustrative rather than comprehensive. We are interested in other topics as they are related to AAPIs, as well as new and innovative ways to conceptualize the linkage, relationality and intersectionality between AAPIs and the environment.
We encourage paper submissions that highlight perspectives of practitioners, academic researchers, and applied policy analysts. If you are interested in submitting a manuscript, please send or email a letter of intent with the title and a very short descriptive paragraph or abstract of the proposed paper to the editors for review. If you have a prepared paper, you may also submit the paper at the same time. For submission guidelines, please visit and click on Style Sheets for Article Submissions (PDF Document).
AAPI Nexus is a peer-reviewed, national journal published by UCLA’s Asian American Studies Center focusing on policies, practices and community research to benefit the nation’s burgeoning Asian American and Pacific Islander communities. The journal’s mission is to facilitate an exchange of ideas and research findings that strengthens the efforts through policy and practice to tackle the pressing societal problems facing Asian American and Pacific Islander (AAPI) communities. Since the inception of ethnic studies, the goal of “serving and mobilizing the community” has been at the heart of Asian American Studies and Pacific Islander Studies. Previous issues have focused on Community Development, Education, and Immigration.
Deadline for Letter of Intent: Monday, July 9, 2012.
Deadline for Manuscript Submissions: Monday, September 10, 2012.
Earlier submission of a Letter or Manuscript is encouraged. Internet communication is preferred. Please address to Managing Editor Melany De La Cruz-Viesca and send to AAPI Nexus Journal at:
Melany De La Cruz-Viesca (nexus@aasc.ucla.edu)
and send an electronic copy to:
Senior Editor Professor Marjorie Kagawa-Singer (mkagawa@ucla.edu)
Guest Editor Professor Paul M. Ong (pmong@ucla.edu)
Guest Editor Professor Julie Sze (jsze@ucdavis.edu)
Guest Editor Charles Lee (Lee.Charles@epamail.epa.gov)
For regular mail, send all correspondence to:
Melany De La Cruz-Viesca, Managing Editor
AAPI Nexus Journal
UCLA Asian American Studies Center
3230 Campbell Hall
Los Angeles, CA 90095-1546
We are pleased to share information on the application process for the National Academy of Education/Spencer Foundation Dissertation and Postdoctoral Fellowship Programs. Please help us widely distribute information on the two fellowship programs to qualified candidates, listservs and other electronic sources by using the paragraphs below. Thank you for your assistance.
The National Academy of Education (NAEd) invites applicants for the following fellowship programs:
National Academy of Education/Spencer Dissertation Fellowship Program
The NAEd/Spencer Dissertation Fellowship Program seeks to encourage a new generation of scholars from a wide range of disciplines and professional fields to undertake research relevant to the improvement of education. These $25,000 fellowships support individuals whose dissertations show potential for bringing fresh and constructive perspectives to the history, theory, or practice of formal or informal education anywhere in the world. Fellows will also attend professional development retreats and receive mentorship from NAEd members and other senior scholars in their field. This highly competitive program aims to identify the most talented emerging researchers conducting dissertation research related to education. The Dissertation Fellowship program receives many more applications than it can fund. This year, up to 600 applications are anticipated and about 25 fellowships will be awarded. Additional guidelines and the fellowship application form will be available on our website later this summer.
National Academy of Education /Spencer Postdoctoral Fellowship Program
The NAEd/Spencer Postdoctoral Fellowship Program supports early-career scholars working in critical areas of educational scholarship. Fellows will receive $55,000 for one academic year of research, or $27,500 for each of two contiguous years, working half time. Fellows will also attend professional development retreats and receive mentorship from NAEd members and other senior scholars in their field. Applicants must have had their PhD, EdD, or equivalent research degree conferred between January 1, 2007, and December 31, 2012. This fellowship is non-residential, and applications from all disciplines are encouraged. Up to twenty NAEd/Spencer Fellowships will be awarded. Additional guidelines and the fellowship application form will be available on our website later this summer.
Contact Information:
Philip Perrin, Program Officer – Professional Development Programs
E-mail: info@naeducation.org
Website: www.naeducation.org
The National Academy of Education greatly appreciates support and funding from the Spencer Foundation to provide and administer these fellowship programs.
National Academy of Education
500 5th St, NW #308
Washington, DC 20001
As a sociologist, I rely heavily on the Census Bureau’s American Community Survey (ACS). The ACS provides thousands of researchers like me comprehensive annual demographic and socioeconomic data about the U.S. population. In fact, almost all the data and statistics that are presented in this site is derived from the ACS. Unfortunately, Congress is considering eliminating funding for the ACS. Below is an announcement about efforts to help save funding so that the ACS can continue to benefit researchers like me and our society as a whole.
At the beginning of May, there were two attacks on funding for social science research in the House of Representatives.
First, the House voted to prohibit the National Science Foundation (NSF) from funding Political Science research – on important issues such as how countries transition to democracy, or the causes of terrorism. The American Journal of Political Science has published a free virtual issue that showcases articles that use NSF funded data. We urge you to contact your Senators and ask them to continue NSF funding for Political Science research.
Second, the House voted to eliminate funding for the American Community Survey (ACS). The ACS asks questions that the Census has used for centuries, and the data is used to help the government distribute more than $800 million in Federal assistance. People may have different perspectives on the questions, but policy decisions are better if they are informed by data. Please send letters/emails to your Senators asking that the ACS not be eliminated.
Please forward this information to colleagues so they can get involved. Detailed information on both of these issues including letters of support from academic organizations and a selection of articles in the press are available at www.mpsanet.org.
Call for Papers: Asian Americans and Culture
The editors of East Main Street: Asian American Popular Culture are seeking contributions to a new collection on Asian American culture within a transnational context. We welcome proposals for original essays that address Asian American experience or representation in popular culture (both current and historical).
In addition to work on media, literature, music, games and digital culture, fashion, consumption and popular practices in and outside the Americas, we encourage submissions that engage with science and technology, sexuality, racial identity, legal studies, sports, politics, and production/industry studies.
Please send a 900-1200 word abstract to the editors (sdave@brandeis.edu, nishime@uwashington.edu, tgoren@uwm.edu,) by August 1, 2012.
Position: Assistant Professor, New College of Florida
New College of Florida, a small residential, highly selective liberal arts college, invites applications for a tenure-track assistant professorship beginning in August 2013. PhD expected by that time. Candidates should be able to demonstrate excellence, or potential for excellence, in teaching. Preference will be given to candidates whose teaching and research interests complement and enhance our existing strengths. We are especially interested in candidates with substantial expertise on race and ethnicity and whose research and teaching employs a social psychological perspective, broadly defined.
New College is committed to excellence in teaching and research, and encourages collaborative student-faculty scholarship. Students are intellectually independent and research-oriented. Teaching load is two courses per semester, plus individualized tutorials and supervision of
senior thesis projects.
Interested candidates should send a letter of application, Curriculum Vitae, a statement of teaching philosophy and research interests, transcripts, and three letters of recommendation to David Brain, New College of Florida, 5800 Bay Shore Drive, Sarasota, FL 34243-2197. Screening of applicants will begin October 1, 2012, and will continue until the position is filled. Individuals with the ability to contribute in meaningful ways to the college’s continuing commitment to cultural and gender diversity, pluralism and individual difference are encouraged to apply.
Consistent with law and New College’s respect for personal dignity, the college does not discriminate between applicants for employment based on race, nationality, religion, age, disability, gender expression, gender identity, veteran status, marital status, or sexual orientation. According to Florida law, applications and meetings regarding applications are open to the public. Applicants who need a reasonable accommodation in order to participate in the selection process must notify the College five days in advance.
The U.S. Census Bureau has finalized their official data on our nation’s population and has just released their report brief “The Asian Population: 2010” that summarizes its major findings about the Asian American population in 2010, and in particular, how it compares to the last decennial Census taken in 2000. Below are some of the most significant highlights.
Growth Since 2000
The Asian American population (monoracial and mixed-race) grew from 11.9 million in 2000 to 17.3 million in 2010. This represents an increase of 45.6% since 2000. This proportional increase from 2000 is the highest of all the major racial/ethnic groups (in comparison, the Latino/Hispanic population grew 43% from 2000 to 2010.
Increases Within Each Ethnic Group
Among the six largest Asian ethnic groups (monoracial and mixed-race), who collective make up over 87% of the total Asian American population, Indians experienced the largest increase — 67.6% — since 2000. All Asian ethnic groups (monoracial and mixed-race) that had a population of at least 1,000 in 2000, Nepalese experienced large increases in their population — from 9,399 to 59,490 in 2010, an increase of 533%. Overall, the largest Asian ethnic group is the Chinese at 3.8 million (monoracial and mixed-race).
Huge Increase in Mixed-Race Asian American Population
Mixed-race Asian Americans (those who self-identified as having some Asian ancestry) increased from 1.6 million in 2000 to 2.6 million in 2010, an increase of 60%. Of all mixed-race Asian Americans, 61% self-identified as half White and half Asian.
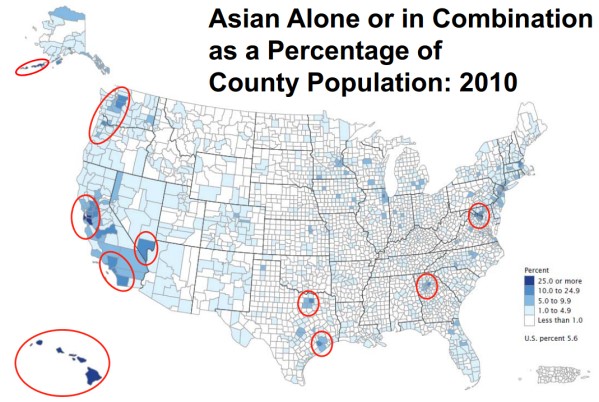
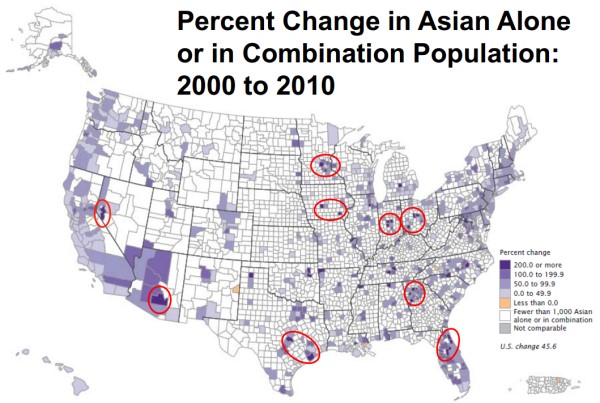
Geographic Distribution
In terms of total numbers, the state with the largest Asian American population, not surprisingly, is California — 5.6 million Asian Americans lived in the Golden State in 2010 and they represented 14.9% of California’s total population. But the state with the highest proportion of its residents being Asian American is Hawai’i — 57.4% of the Aloha State’s population is Asian American. The state that experienced the biggest increase in its Asian American population from 2000 to 2010 is Nevada — from 112,246 to 242,916, an increase of 114%.
The first map below shows the proportion of Asian Americans by county in 2010. The second map shows the growth of Asian American residents by county in 2010.
Again, you can read more findings from the 2010 Census about the Asian American population in the Census Bureau’s recently-released summary report, The Asian Population: 2010.
One of the most popular and controversial articles on my Asian-Nation.org site is the one on Interracial Dating and Marriage. This is a topic that has provoked much discussion and debate among Asian Americans through the years and continues to do so today. Within the larger range of opinions on interracial dating and marriage, many Asian Americans and non-Asians alike consider dating and marrying someone outside of your racial/ethnic group as a natural progression of Asian Americans becoming more integrated into the mainstream, while others see it as renouncing one’s Asian identity.
As the saying goes, you are entitled to your opinion, but not your facts. In that context, as a sociologist, I try to make an empirically-sound and objective contribution to this debate by presenting updated data and statistics from the 2010 U.S. Census American Community Survey (ACS) on the racial/ethnic marriage patterns of Asian Americans for both men and women and the six largest Asian ethnic groups. The full tables are presented in my Interracial Dating and Marriage page, but below is a summary of recent trends and changes from 2006, the last time I updated these statistics:
Consistently, rates of marriages involving Asian Americans and Whites have declined. Specifically, among those marriages in which both spouses are U.S.-raised (either born in the U.S. or immigrated before age 13, and thereby socialized within the U.S. racial/ethnic landscape), for five of the six Asian American ethnic groups, the rates of having a White spouse for both men and women declined from 2006 to 2010. Among men/husbands, the largest decline involved Asian Indians and Koreans. For women/wives, the largest decline was for Filipinos and Koreans.
The only exceptions to this trend of declining rates of White-Asian marriages were for Asian Indian women/wives (whose rate slightly increased from 2006 to 2010) and for both Vietnamese men/husbands and women/wives. For Vietnamese men, their rates of having a White wife increased from 15.0% to 21.9% while for Vietnamese women, their rate for having a White husband jumped from 28.3% to 41.3%.
Strangely, the population sizes for U.S.-raised married Vietnamese American men and women declined from 2006 to 2010. For example, in 2006, there were about 40,500 and 45,200 U.S.-raised Vietnamese men and women respectively who were married. In 2010, those numbers declined to 26,795 and 34,998. Some possible explanations are that many who were married in 2006 got divorced, U.S.-raised Vietnamese men and women are delaying getting married, and/or many U.S.-raised Vietnamese have changed their ethnic identity to some other ethnic group, such as Chinese or Hmong.
In contrast to the declining rates of Asian-White marriages, the rates for Pan-Asian/Other Asian marriages have increased notably from 2006 to 2010 (having a spouse of a different Asian ethnicity). This increase was almost universal across all the six ethnic groups and for both genders (the only exception was for Filipino women). Among U.S.-raised men/husbands, Vietnamese Americans experienced the biggest increases in having a pan-Asian spouse — from 5.8% in 2006 to 13.7% in 2010 for men and from 7.8% to 12.2% for women/wives.
Following up on my earlier post about a few interesting interactive infographics showing population-related data from the Census and other sources, the Census Bureau has begun to release results from the 2010 Census for each state and has created an interactive application (below) that summarizes changes in the state’s population by counties and racial/ethnic group (to change states, click on the “Select Another State” link at the top of the graphic):
Data for more states will be released in the next few months, so if the state you’re interested in is not yet listed, check back a little later and eventually it will be up.
The Census has another interactive graphic below that shows state-level changes in population from 2000 to 2010, along with historical changes in population for each state since 1910. This is basically the data upon which state governments will use to reapportion their Congressional districts in time for the next Congressional elections in 2012. You might recall that a few states will lose one or more seats in the House of Representatives (most of whom are in the midwest and northeast) because their population either declined or was stagnant while other states (mainly in the south and west) will gain seats because their populations increased.
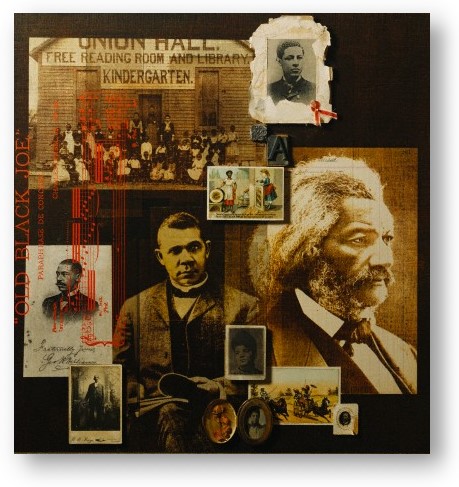
To commemorate and celebrate the contributions to our nation made by people of African descent, American historian Carter G. Woodson established Black History Week. The first celebration occurred on Feb. 12, 1926. For many years, the second week of February was set aside for this celebration to coincide with the birthdays of abolitionist/editor Frederick Douglass and Abraham Lincoln. In 1976, as part of the nation’s bicentennial, the week was expanded into Black History Month. Each year, U.S. presidents proclaim February as National African-American History Month.
41.8 million
As of July 1, 2009, the estimated population of black residents in the United States, including those of more than one race. They made up 13.6 percent of the total U.S. population. This figure represents an increase of more than a half-million residents from one year earlier.
38%
Percentage of Mississippi’s population that was black in 2009. Although New York had the largest number of blacks of any state, Mississippi had the largest share of blacks in its total population. Blacks also made up more than a quarter of the population in Louisiana (33%), Georgia (31%), Maryland (31%), South Carolina (29%) and Alabama (27%). They comprised 55% of the population in the District of Columbia.
19%
Percentage of blacks 25 and older who had a bachelor’s degree or higher in 2009.
11.5 million
Among blacks 25 and older, the number who had an advanced degree in 2009 (e.g., master’s, doctorate, medical or law). A decade earlier, in 1999, about 900,000 blacks had this level of education.
2.5 million
Number of black college students in fall 2008. This was roughly double the corresponding number from 25 years earlier.
55%
Turnout rate in the 2008 presidential election for the 18- to 24-year-old citizen black population, an 8 percent increase from 2004. Blacks had the highest turnout rate in this age group.
65%
Turnout rate among black citizens in the 2008 presidential election, up about 5 percentage points from 2004. Looking at voter turnout by race and Hispanic origin, non-Hispanic whites and blacks had the highest turnout levels.
$32,584
The annual median income of single-race black households in 2009, a decline of 4.4 percent (in 2009 constant dollars) from 2008.
28%
The percentage of single-race blacks 16 and older who worked in management, professional and related occupations.
$137.4 billion
Receipts for black-owned businesses in 2007, up 55.1 percent from 2002. The number of black-owned businesses totaled 1.9 million in 2007, up 60.5 percent.
Earlier this week, the Census Bureau released its first official data from the 2010 census. They also produced the interactive graphic below where you can get more detailed numbers by state (you can visit the Census’s site for a full-screen version), but the main findings are:
As of April 1, 2010, the U.S.’s population is officially 308,745,538 — an increase of 9.7% from the 2000 census.
This 9.7% increase is much smaller than the 13.2% increase from 1990-2000 and actually is the smallest increase since 1940.
Nonetheless, the U.S.’s population is still growing faster than other industrialized nations: in the past decade, the populations in France and England each increased about 5%, about 6% in China, and 10% in Canada. Japan’s population is largely unchanged and is actually declining in Germany.
As news organizations such as MSNBC report, the 2010 Census data shows that several states in the South and West are gaining population (and some new seats in the House of Representatives) while a few states in the Northeast and Midwest are losing population:
The most populous state was California (37,253,956); the least populous, Wyoming (563,626). The state that gained the most numerically since 2010 was Texas (up 4,293,741 to 25,145,561); the state that gained the most as a percentage was Nevada (up 35 percent to 2,700,551).
Politically, Texas will gain four House seats due to a burgeoning Hispanic population and a diversified economy that held up relatively well during the recession. Other winners are GOP-leaning Arizona (1), Florida (2) . . . Georgia (1), South Carolina (1), Utah (1) and Washington (1).
States that lose seats are: Illinois (1), Iowa (1), Louisiana (1), Massachusetts (1), Michigan (1), Missouri (1), New Jersey (1), New York (2), Ohio (2), Pennsylvania (1). The Ohio and New York losses typify many of the Democratic strongholds carried by Barack Obama in 2008 that saw declines in political influence. And, for the first time in its history, Democratic-leaning California did not gain a House seat after a census after losing many of its residents in the last decade to neighboring states.
It would seem that these latest Census numbers favor Republicans in the 2012 election. But as the New York Times points out, much of the population increase is due to the fast-growing Latino population:
[P]opulation gains in the South and West were driven overwhelmingly by minorities, particularly Hispanics, and the new districts, according to the rules of redistricting, will need to be drawn in places where they live, opening potential advantages for Democrats, who tend to be more popular among minorities. . . . [T]he most lasting political impact for Republicans and Democrats alike is the rise in the influence of Hispanic voters, particularly across Arizona, Nevada and Texas, which underscores the urgency facing both parties in finding new ways to appeal to Hispanics. In future presidential races, Democrats believe they can make inroads into Arizona and Texas, which are traditionally carried by Republicans, particularly if voters speak out against Arizona’s tough immigration law.
The way it’s shaping up, it looks like the Latino population will play a big role in determining who wins or loses many elections in the South and West. Given that, just last week, Republicans fought hard to defeat the DREAM Act and given their history of supporting (or at least being largely indifferent to) numerous anti-immigrant movements and legislation, it’s too early to say that Republicans will have an easy time in the 2010 elections.
Here are some more announcements and links out that have come my way relating to Asians or Asian Americans. As always, links to other sites are provided for informational purposes and do not necessarily imply an endorsement of their contents.
The Social Justice Fund currently makes 8 to 10 grants annually of up to $2,000 for grassroots activist projects in the US and around the world, giving priority to those with small budgets and little access to more mainstream funding sources. Please read these guidelines carefully and review our rosters of past grants on our website before applying to the Muste Institute for funding.
Next deadline: April 19, 2010 (for grants decided in mid-June). Subsequent deadlines to be posted after May 1, 2010. The Muste Institute’s Social Justice Fund considers proposals:
For new projects or campaigns, or efforts to expand existing work
For projects with expense budgets under $50,000
For projects which are local, regional, national or global in scope
From groups located anywhere in the world
From grassroots organizations with annual expenses of less than $500,000
From groups with limited or no access to more mainstream funding sources
From groups that may be unincorporated or incorporated*
From groups with or without 501(c)3 status or a fiscal sponsor*
From groups which have not received Social Justice Grants from us in at least two years
The Social Justice Fund’s priority is to support:
Direct grassroots activism and organizing
Groups with diverse, representative and democratic internal leadership structures
Groups which have or can obtain sufficient economic and in-kind support from a diversity of sources to carry out their regular work, but need additional support for a particular project
You can visit the A.J. Muste Institute website for more information on eligibility and how to apply.
Vietnamese Oral History Project
I’m emailing today because we all have one common interest — preserving Vietnamese history and culture. My friend Linh Tran and I are starting a new project and hope that with your help, we can turn our ambitions into a reality.
Our mission is to record, document and preserve the stories of every single Vietnamese refugee who fled the country after the Fall of Saigon. We as Vietnamese people have a very unique, important story and unless we make efforts to preserve those histories in some way, it’ll be lost in text books, in our children and our children’s children. Although there have been some attempts to document our story, not one project has done it on the global scale that we want to reach.
This is why Linh and I want to start to collect individual stories of this journey — modeled after the nationally recognized StoryCorps and Steven Spielberg’s Jewish Film Archive. We are compiling a video documentary, archive and multimedia-driven project that will serve the Vietnamese people, let them tell their stories and also be a platform to educate others from different origins and backgrounds about our story. It’ll temporarily be called “From Vietnam to Freedom” and will be housed online.
We’re emailing you because we’d like for you to either contribute your story, someone else’s story or help us connect more with the Vietnamese community to spread the word. We know with your help, we can truly make a difference in our global community. We hope that you’ll contribute in some way.
Thanks very much.
Best,
Kim Thai, kthai6@gmail.com
Linh Tran, tranl847@gmail.com
Mavericks of Asian Pacific Islander Descent announces the 1st Asian Pacific Islander TV Pilot Shootout sponsored by Fox Diversity. The winner will receive the opportunity to pitch a TV executive at Fox.
Writers will submit a synopsis, logline, and sample pages from a completed original television pilot script as well as submit a video of a two minute television pilot pitch. The top five pitch ideas chosen by judges will be matched with directors who will also be selected by submission process. The directors will be given seed money partially derived from the entry fees and work with the writer to develop a 1 minute teaser of the pilot. Actors and production crew are also encouraged to apply to be considered for the chosen projects. Submission deadline for writers is June 9.
The five completed teasers will premiere at the Japanese American National Museum’s ID Film Fest October 10, 2010. The ID Film Fest will include screenings and workshops. The co-presenters of the ID Film Fest will include JANM, director Justin Lin and You Offend Me, You Offend My Family, director Quentin Lee, producer and writer Koji Steven Sakai, director Jessica Sanders, and Phil Yu of AngryAsianMan.com.
MAPID’s focus is to assist, develop, and promote Asian Pacific Islanders in entertainment. Producer of Breaking the Bow which involved over 70 API artists, MAPID conducts an API writing group, presents Battle of the Pitches, and co-presents the successful short screenplay competition with the Los Angeles Asian Pacific Film Festival. Complete instructions can be found at mapid.us/tvpilotshootout. For more information, contact Ken Choy at ken@mapid.us.
The 2010 Census deadline is approaching, and as you know, it is critical to have the entire Asian American community participate. An accurate count can help us receive our share of over $400 billion in annual federal funds for services our community needs. Unfortunately, past decades have shown that Asian Americans are among the groups most likely to discard their Census forms.
Fill In Our Future is a campaign created by AAPI Action to promote and encourage the participation of the Asian American community in the 2010 Census. Our website, fillinourfuture.org, features frequently asked Census questions, in-language resources (in over 24 Asian languages), informational brochures, sample Census forms, in-language assistance guides, celebrity and community leader PSA’s (Public Service Announcements) and monthly contests and giveaways. The larger campaign also includes media and community outreach, workshops, a speaker’s bureau and training seminars.
As the Asian American and Pacific Islander population continues to grow and change, the data from the Census will help leaders obtain the best services, resources, and programs to meet our community needs. Please utilize and share the following resource links with your readers: Website, Facebook Fan Page, and Twitter.
Here are some more announcements and links out that have come my way relating to Asians or Asian Americans. As always, links to other sites are provided for informational purposes and do not necessarily imply an endorsement of their contents.
I am currently at the Asian Pacific American Legal Center in Los Angeles. We’re anchoring a statewide network that is outreaching to the AAPI community to inform them about the importance of participation in the upcoming census. We’ve just launched our nationwide APICount PSA contest:
Our Communities Need to be Counted in Census 2010!
Asian and Pacific Islander Communities are underrepresented by Census numbers, but you can help change that! Help get the word out by making a 30 – 60 second video about how the Census is safe, easy and important. Your video could screen at the Los Angeles Asian Pacific American Film Fest 2010, be seen nationally, and win you the grand prize of $3000! Fill out an entry form at apicount.com and get started now!!! Deadline for entries is March 26th, 2010.
SAALT’s summer internships allow students to help promote the civic and political engagement of South Asians in the United States. We encourage applications from undergraduate, graduate, and law students who are self-motivated and committed to working toward social change in your community.
Two internships are available for Summer 2010:
Program and Campaigns Intern
The Program and Campaigns Intern will promote the mission of SAALT’s community mobilization, partnerships, and policy work.
Communications Intern
The Communications Intern will provide support for all of SAALT’s online, media, and other communications, including website development, media outreach, social networking outreach, and community outreach.
Internship applications are accepted on a rolling basis, with priority consideration to those received by March 26.
SAALT is also seeking a Be The Change National Coordinator. SAALT is seeking a dynamic, enthusiastic, hard-working individual to spearhead Be the Change efforts in 2010. The Be The Change National Coordinator will coordinate logistics, materials, correspondence, trainings, and implementation of the October 2, 2010 Be the Change National Gandhi Day of Service.
Visit the SAALT website for more details and how to apply.
The Asian & Pacific Islander American Health Forum (APIAHF) seeks a Community Capacity Program Coordinator.
Full Time (37.5 hours/week)
Salary Range: Competitive, excellent fringe benefits
Reports to: Community Capacity Program Director
Location: Washington, DC
Job Summary:
The Program Coordinator will be responsible for coordinating the various activities of a funded body of work related to capacity development. The Program Coordinator will be responsible for performing grant administration and support activities such as but not limited to: assisting in program documentation and developing products, managing electronic program telecommunications, websites and databases, and conference and meeting planning and coordination. The Program Coordinator, in conjunction with the Community Capacity Program Director, will work towards achieving the mission and aims of the grant.
Duties and Responsibilities:
Coordinate activities related to all the components of a large capacity development grant program
Assist in program documentation and development of products (e.g. program pamphlets, factsheets, presentations, press releases, requests for proposals/reports, monitoring guidelines, scientific articles)
Manage and update electronic program telecommunications, databases, and websites (e.g. HTA webpage, HTA Partner’s website)
Research via the internet and other sources, on topics related to AA and NHPI health, capacity building, and other issues as assigned
Plan and coordinate national, regional, and local conferences and meetings
Travel for work-related meetings and events as required
Perform other duties as assigned
Required Qualifications:
Bachelor’s or Master’s degree
3+ years experience working in an office environment
Intermediate/Advanced user of MS Office
Highly proficient in using the internet
Experience in conference planning and coordination
Project coordination experience with increasing levels of responsibility
Experience with calendaring and scheduling meetings
Ability to multi-task
Experience and/or interest in working with minority health/health care issues
Experience and/or interest working in a diverse and high energy team environment
If interested, please submit cover letter and resume to:
Via Email (preferred): hr@apiahf.org, Attn: Community Capacity Program Coordinator Search
Via Fax: 415-954-9999
Via Mail: APIAHF
Attn: HR Manager – Community Capacity Program Coordinator Search
450 Sutter Street, Suite 600
San Francisco, CA 94108
We’re working and baking together again in our fourth year for “A Little Peace: A Dessert Tasting†to help fundraise for social justice organizations. We support each other and build community with nurturing and sweet things so that we can build a stronger effort for a better and more progressive society. Please come join us and taste for yourself the creativity of the community’s best bakers!
The Bake-Off Challenge, sponsored by Ocean Spray, features a flavored Craisin this year. Contestants provide samples for attendees to vote on the best dessert, and winners will be awarded prizes. If you are interested in participating, please email us for more information and to receive the Craisins in advance!
Proceeds Benefit the Asian American Resource Workshop, the API Movement, Boston Korean Adoptees, Inc., and Coalition for Asian Pacific American Youth. Community Partners include the National Association of Asian American Professionals – Boston and Viet-AID. Our corporate sponsor is Ocean Spray.
Date: Saturday, April 24, 2010
Time: 7:00pm – 10:00pm
Location: VIET – AID , 42 Charles St., Dorchester, MA
Tickets: $20 in advance / $27 at the door
Children: $10 (10 and younger)
To purchase, visit: aarw.org/dessert2010/
Questions? Email: dessert@aarw.org
Here are some more announcements and links out that have come my way relating to Asians or Asian Americans. As always, links to other sites are provided for informational purposes and do not necessarily imply an endorsement of their contents.
The Asian American Studies Program at Hunter College, The City University of New York, currently seeks candidates to teach Asian American Studies courses in History, Political Science, Economics, Community Studies, and Psychology. Applicants must have an M.A. or ABD in a relevant field, as well as a record of successful undergraduate teaching.
The Asian American Studies Program (AASP) at Hunter College was founded in 1993 on the initiative of students and faculty. Today, we are a small but dynamic program with a growing number of minors, and we offer approximately 12 courses per semester, ranging from our interdisciplinary survey courses to more advanced courses in Literature, Cultural Studies, and Diasporic community formations — West Asian American, Chinese American, and Korean American in particular.
Located in the heart of New York City, the AASP works closely with Asian American organizations to build and sustain ties to local communities and concerns. Affiliated full-time faculty in the College are located in areas as diverse as Urban Studies, Film and Media, Sociology, English, and Dance.
Applicants should ideally be prepared to teach the interdisciplinary survey course as well as relevant courses within the scope of their fields of research. The majority of our courses are taught by adjunct faculty, and as a result, the work you will do in our program is crucial to the process of introducing undergraduates to concepts concerning Asian American history and experience; we hope to work with dedicated, effective, and intelligent educators, and we seek to provide a welcoming and supportive work environment for our faculty.
Please visit the department website for more information concerning our course offerings, faculty, or student activities. Please send CV, letter of intent, and contact information for at least 3 references to:
Jennifer Hayashida, Acting Director
Asian American Studies Program
Hunter College, CUNY
695 Park Avenue, Room 1037HE
New York, NY 10065
The University of North Carolina Chapel Hill offers the Moore Undergraduate Research Apprentice Program (MURAP) for rising junior and seniors who are interested in pursuing a career in academia. I have served as a MURAP faculty mentor last summer — they have traditionally not received many applications from Asian American students and/or students hoping to pursue Asian American research topics; hence, I am trying to solicit all of you for your best and brightest undergraduate students interested in one day getting into the PhD pipeline.
Best,
Jennifer Ho
UNC Chapel Hill
Short-Term Research Positions on Census 2010
The U.S. Census Bureau is seeking up to 18 ethnographers to do short-term research in nine race/ethnic research sites during Census 2010 field data collection operations as contractors for 4-6 months. Past research has shown that race/ethnic minority subpopulations are differentially miscounted, with implications for possible imbalances in congressional representation and allocation of federal funds.
Examples of miscounts include persons not included on the census form who should be counted in the household, persons counted in more than one place or in the wrong place, and missed housing units. The study aims to document how and why miscounts happen, who is affected, and what can be improved to reduce miscounting in future censuses.
This comparative qualitative study of enumeration methods and coverage in nine race/ethnic sites will be conducted in 2010 in three census operations. The objectives are to identify 1) types of coverage error; 2) sources of coverage error (e.g., questionnaire issues, interviewer error, residence rules, socio-cultural and/or language factors, complex households, etc.); and 3) characteristics of households and persons with coverage error; and to 4) assess the extent to which these are similar or different across the race/ethnic groups, and to 5) recommend how to improve coverage of race/ethnic groups.
Current Summary of Scope of Work: Each researcher will receive training at Census Bureau headquarters in Suitland, Maryland. Each researcher will go to his/her designated race/ethnic site for 7-9 continuous days during one of three specific census data collection time periods to accompany census interviewers as they conduct 35 interviews. The researcher will tape and unobtrusively observe and listen to the census interview for cues of possible coverage errors and/or household relationships not identified with the census relationship question.
If there is such a cue, the researcher will conduct an immediate targeted semi-structured debriefing with the respondent to resolve questions as to where each person should be counted, according to the census residence rules, and to clearly delineate household composition. The researcher will transcribe interviews (perhaps at a Census secure location), analyze data, write case studies, write a site report addressing the objectives and other factors identified in the research, and give a Census Bureau talk. The methodology may change somewhat before it is finalized.
Race/ethnic subpopulations: We seek 2 ethnographers to do studies in each group: American Indian (reservation), Alaska Native, African American, Asian, Hispanic/Latino, Middle Eastern, Native Hawaiian/Other Pacific Islander, White (non-Hispanic), and Generalized site. Research sites will be designated by the Census Bureau.
Specific Time Periods for Field Research: Census operations are on a strict timetable and just one researcher will be in each site in each operation. To ensure each site and operation is covered, all selected researchers must commit in writing to full-time work for 7-9 continuous days in their designated sites during one of the following time periods: March 29 – April 9: American Indian reservation; May 5 – May 22: Sites other than the Indian reservation; August 30 – Sept. 30: All sites.
Compensation will be determined soon. If you are interested and would like to learn more, compile the following:
Cover letter, including information directly relevant to this study and its methodology:
Any experience with past censuses and/or surveys
Experience with unobtrusive observation and debriefings
Identification of the race/ethnic subpopulation with which you have done past research, and the specific US research locations (preference will be given to those with past or present race/ethnic research sites in the US)
Any foreign language fluency, with level of fluency in conversation
State your US citizenship status (you must be a US citizen)
Attachments:
Current resume or CV
Brief summary of your past research with the race/ethnic group you have chosen, including research design and methods employed. Identify the specific US location(s) where you conducted your past research
Please specify if you are/are not of the same race/ethnicity as the group you wish to study
Representative paper or report showing methodology and/or results relevant to this proposed study (less than 25 pages)
Dates of observation in this study: State which of the three observation time period(s) listed above when you will be available to spend 7-9 continuous days of observation at the site (you will need to commit to one of these time periods in writing in order to be selected for this study).
Send these materials: 1) if by e-mail, send to all contact people below, OR 2) if by regular mail, send to just one: Laurel Schwede, Matt Clifton, or Rodney Terry:
By regular mail:
U.S. Census Bureau
Statistical Research Division
4600 Silver Hill Road
Washington, D.C. 20233
By FEDEX or UPS:
U.S. Census Bureau
Statistical Research Division
4600 Silver Hill Road
Suitland, MD 20746
Deadlines: American Indian site: February 1, 2010. Other sites: February 10, 2010.
The Program in Asian American Studies and the Institute for Advanced Study at the University of Minnesota invite applications for the 2010-2011 Postdoctoral Fellowship in Hmong Studies.The fellowship is for work in any field of Hmong Studies and is generously funded by a grant from the Henry Luce Foundation.
Applicants should conduct research germane to Hmong Studies. Proposed research projects should have the potential to make a significant contribution to the field. During their stay at the University of Minnesota, postdoctoral fellows will be expected to participate in research, teaching, and service. While research is the primary responsibility, fellows will be expected to teach one course related to their research interests and consonant with the curricular needs of the Asian American Studies program. In addition, fellows are expected to give one talk on campus on their research project.
The stipend for 2010-2011 year will be $45,000, with full fringe benefits. The Institute for Advanced Study will provide the fellow with office space and routine office support for photocopying, faxing, mailing, etc. A doctoral degree in hand is required by August 30, 2010. Preference will be given to applicants who have completed their degrees in the past five years. The postdoctoral fellowship will begin on August 30, 2010, is for one year, and is non-renewable.
Applications should be completed on-line through the University of Minnesota Job Site. Search for requisition #164296 and follow instructions. Review of applications will begin on February 8, 2010. If you have any questions, please contact Ann Waltner (waltn001@umn.edu) or Erika Lee (erikalee@umn.edu.
This post doesn’t focus on Asian Americans or racial/ethnic issues specifically but is certainly relevant to those kinds of discussion since it deals with what aggregate-level statistics can tell us about a person’s day-to-day life.
During this current economic recession, many of us are very aware of how it has affected our lives and perhaps the lives of those close to us. But beyond the grim stats about rising unemployment numbers that we hear on the news, what is the aggregate effect of the recession on Americans as a collective group? For many sociology students, this question might be rephrased as, “What can aggregate-level data tell us about individual lives?”
To try to answer that question, the Census Bureau has just released a report that describes how the recession has led Americans to make changes in many areas of their lives:
Preliminary data earlier this year found that many Americans were not moving, staying put in big cities rather than migrating to the Sunbelt because of frozen lines of credit. Mobility is at a 60-year low, upending population trends ahead of the 2010 census. . . . The percentage of people who drove alone to work dropped last year to 75.5 percent, the lowest in a decade, as commuters grew weary of paying close to $4 a gallon for gasoline and opted to carpool or take public transportation. . . .
Average commute times edged up to 25.5 minutes, erasing years of decreases to stand at the level of 2000, as people had to leave home earlier in the morning to pick up friends for their ride to work or to catch a bus or subway train. . . . Average commute times edged up to 25.5 minutes, erasing years of decreases to stand at the level of 2000, as people had to leave home earlier in the morning to pick up friends for their ride to work or to catch a bus or subway train. . . .
Nearly 1 in 3 Americans 15 and over, or 31.2 percent, reported they had never been married, the highest level in a decade. . . . Sociologists say younger people are taking longer to reach economic independence and consider marriage because they are struggling to find work or focusing on an advanced education. . . .
The homeownership rate fell to 66.6 percent last year, the lowest in six years, after hitting a peak of 67.3 percent in 2006. Residents in crowded housing jumped to 1.1 percent, the highest since 2004, a sign people were “doubling up” with relatives or friends to save money. . . .
More people are getting high school diplomas. Only two states, Texas and Mississippi, had at least 1 in 5 adults without high school diplomas. This is down from 17 states in 2000 and 37 in 1990. More older people are working. About 15.5 percent of Americans 65 and over, or 6.1 million, were in the labor force. That’s up from 15 percent in 2007.
It is probably no surprise that the recession has led many Americans to put off big life-changing events such as moving far away, getting married, or buying a house, along with smaller-scale changes such as driving alone less, more carpooling, sharing apartments, or working later in life. Many of us can relate to many of these changes ourselves.
What may be surprising is that aggregate-level data and statistics like this can capture such individual-level behavior and therefore give us a more fuller picture of how institutional events like an economic recession eventually affect the day-to-day lives of Americans on the aggregate level.
My point is that data like this are a nice example of how aggregate-level statistics help us understand individual-level actions. It’s with that in mind that I again urge everyone to complete and return the Census forms that will be sent out in a few months.
The Pew Research Group has just released reports based on Census data that describe the demographic and socioeconomic characteristics of the five largest Latino groups in the U.S. (Mexican, Puerto Rican, Cuban, Salvadoran, and Dominican).
More than eight-in-ten Hispanics self-identify themselves as being either of Mexican, Puerto Rican, Cuban, Salvadoran or Dominican origin. Hispanics of Mexican origin are by far the largest group, accounting for nearly two-thirds of the Hispanic population in the U.S.
The five population groups differ along several dimensions — for example, in the share of each group that is foreign born, citizen (by birth or naturalization) and proficient in English. The groups vary by average age and tend to live in different areas within the United States. Likewise, the groups display varying levels of education, homeownership rates, and poverty rates.
These and other characteristics are explored in five fact sheets, one for each country-of-origin group. Each population is also compared to all Hispanics and the U.S. population overall.
As we all know, issues directly related to the Latino population such as immigration continue to be highly controversial and hotly debated. Hopefully these fact sheets will provide a valid and sound statistical foundation upon which we can all better understand their characteristics as we proceed with such discussions.