The views and opinions expressed on this site and blog posts (excluding comments on blog posts left by others) are entirely my own and do not represent those of any employer or organization with whom I am currently or previously have been associated.
Academic Version: Applying my personal experiences and academic research as a professor of Sociology and Asian American Studies to provide a more complete understanding of political, economic, and cultural issues and current events related to American race relations, and Asia/Asian America in particular.
Plain English: Trying to put my Ph.D. to good use.
You may know that May is Asian Pacific American (APA) Heritage Month. To recognize this occasion, the U.S. Census Bureau has released its annual “Facts for Figures” report that summarizes some interesting demographic facts and data about the APA population. Below are a few interesting data tidbits:
18.9 million
The estimated number of U.S. residents in 2012 who said they were Asian alone or Asian in combination with one or more other races. This group comprised slightly less than 6 percent of the total U.S. population.
46.0%
Percentage growth of the Asian alone or in combination population between the 2000 and 2010 censuses, which was more than any other major race group.
4.2 million
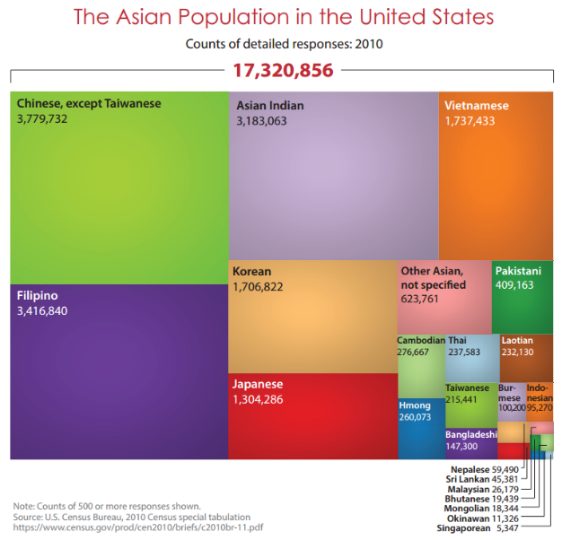
Number of Asians of Chinese, except Taiwanese, descent in the U.S. in 2012. The Chinese (except Taiwanese) population was the largest Asian group, followed by Filipinos (3.6 million), Asian Indians (3.3 million), Vietnamese (1.9 million), Koreans (1.8 million) and Japanese (1.3 million). These estimates represent the number of people who reported a specific detailed Asian group alone, as well as people who reported that detailed Asian group in combination with one or more other detailed Asian groups or another race(s).
$70,644
Median income of households headed by the Asian alone population in 2012. Median household income differed greatly by Asian group. For Asian Indians, for example, the median income in 2012 was $96,782; for Bangladeshi, it was $44,293. (These figures represent the Asian alone population.)
50.5%
The percentage of the Asian alone population 25 and older who had a bachelor’s degree or higher level of education. This compared with 29.1 percent for all Americans 25 and older.
21.2%
The percentage of 25-and-older Asian alone population who had a graduate or professional degree. This compared with 10.9 percent for all Americans 25 and older.
49.1%
The proportion of civilian employed Asian alone population 16 and older who worked in management, business, science and arts occupations, such as financial managers, engineers, teachers and registered nurses in 2012. Additionally, 17.3 percent worked in service occupations, 20.6 percent in sales and office occupations, 9.7 percent in production, transportation and material moving occupations and 3.2 percent in natural resources, construction and maintenance occupations.
88.6%
Percentage of Asian alone population in 2012 living in a household with Internet use — the highest rate among race and ethnic groups.
The U.S. Census Bureau has finalized their official data on our nation’s population and has just released their report brief “The Asian Population: 2010” that summarizes its major findings about the Asian American population in 2010, and in particular, how it compares to the last decennial Census taken in 2000. Below are some of the most significant highlights.
Growth Since 2000
The Asian American population (monoracial and mixed-race) grew from 11.9 million in 2000 to 17.3 million in 2010. This represents an increase of 45.6% since 2000. This proportional increase from 2000 is the highest of all the major racial/ethnic groups (in comparison, the Latino/Hispanic population grew 43% from 2000 to 2010.
Increases Within Each Ethnic Group
Among the six largest Asian ethnic groups (monoracial and mixed-race), who collective make up over 87% of the total Asian American population, Indians experienced the largest increase — 67.6% — since 2000. All Asian ethnic groups (monoracial and mixed-race) that had a population of at least 1,000 in 2000, Nepalese experienced large increases in their population — from 9,399 to 59,490 in 2010, an increase of 533%. Overall, the largest Asian ethnic group is the Chinese at 3.8 million (monoracial and mixed-race).
Huge Increase in Mixed-Race Asian American Population
Mixed-race Asian Americans (those who self-identified as having some Asian ancestry) increased from 1.6 million in 2000 to 2.6 million in 2010, an increase of 60%. Of all mixed-race Asian Americans, 61% self-identified as half White and half Asian.
Geographic Distribution
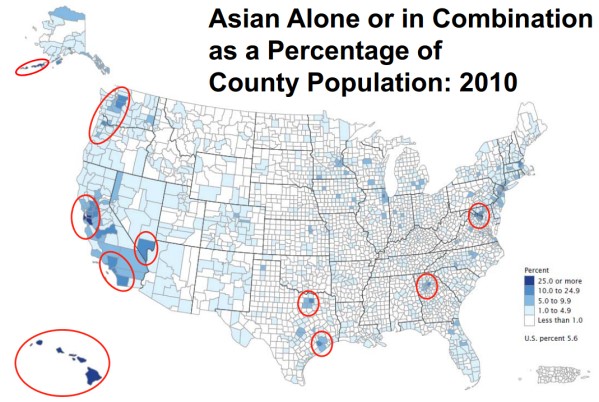
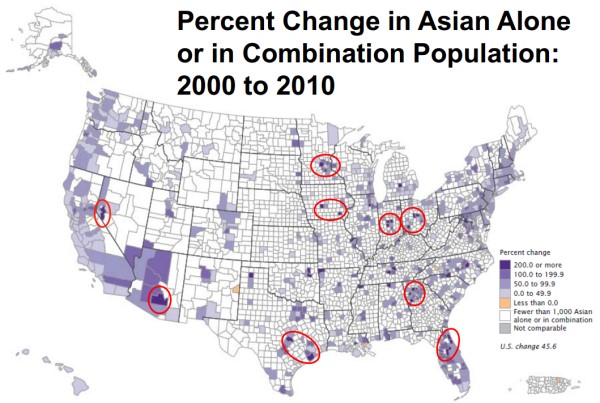
In terms of total numbers, the state with the largest Asian American population, not surprisingly, is California — 5.6 million Asian Americans lived in the Golden State in 2010 and they represented 14.9% of California’s total population. But the state with the highest proportion of its residents being Asian American is Hawai’i — 57.4% of the Aloha State’s population is Asian American. The state that experienced the biggest increase in its Asian American population from 2000 to 2010 is Nevada — from 112,246 to 242,916, an increase of 114%.
The first map below shows the proportion of Asian Americans by county in 2010. The second map shows the growth of Asian American residents by county in 2010.
Again, you can read more findings from the 2010 Census about the Asian American population in the Census Bureau’s recently-released summary report, The Asian Population: 2010.
Following up on my earlier post about a few interesting interactive infographics showing population-related data from the Census and other sources, the Census Bureau has begun to release results from the 2010 Census for each state and has created an interactive application (below) that summarizes changes in the state’s population by counties and racial/ethnic group (to change states, click on the “Select Another State” link at the top of the graphic):
Data for more states will be released in the next few months, so if the state you’re interested in is not yet listed, check back a little later and eventually it will be up.
The Census has another interactive graphic below that shows state-level changes in population from 2000 to 2010, along with historical changes in population for each state since 1910. This is basically the data upon which state governments will use to reapportion their Congressional districts in time for the next Congressional elections in 2012. You might recall that a few states will lose one or more seats in the House of Representatives (most of whom are in the midwest and northeast) because their population either declined or was stagnant while other states (mainly in the south and west) will gain seats because their populations increased.
Earlier this week, the Census Bureau released its first official data from the 2010 census. They also produced the interactive graphic below where you can get more detailed numbers by state (you can visit the Census’s site for a full-screen version), but the main findings are:
As of April 1, 2010, the U.S.’s population is officially 308,745,538 — an increase of 9.7% from the 2000 census.
This 9.7% increase is much smaller than the 13.2% increase from 1990-2000 and actually is the smallest increase since 1940.
Nonetheless, the U.S.’s population is still growing faster than other industrialized nations: in the past decade, the populations in France and England each increased about 5%, about 6% in China, and 10% in Canada. Japan’s population is largely unchanged and is actually declining in Germany.
As news organizations such as MSNBC report, the 2010 Census data shows that several states in the South and West are gaining population (and some new seats in the House of Representatives) while a few states in the Northeast and Midwest are losing population:
The most populous state was California (37,253,956); the least populous, Wyoming (563,626). The state that gained the most numerically since 2010 was Texas (up 4,293,741 to 25,145,561); the state that gained the most as a percentage was Nevada (up 35 percent to 2,700,551).
Politically, Texas will gain four House seats due to a burgeoning Hispanic population and a diversified economy that held up relatively well during the recession. Other winners are GOP-leaning Arizona (1), Florida (2) . . . Georgia (1), South Carolina (1), Utah (1) and Washington (1).
States that lose seats are: Illinois (1), Iowa (1), Louisiana (1), Massachusetts (1), Michigan (1), Missouri (1), New Jersey (1), New York (2), Ohio (2), Pennsylvania (1). The Ohio and New York losses typify many of the Democratic strongholds carried by Barack Obama in 2008 that saw declines in political influence. And, for the first time in its history, Democratic-leaning California did not gain a House seat after a census after losing many of its residents in the last decade to neighboring states.
It would seem that these latest Census numbers favor Republicans in the 2012 election. But as the New York Times points out, much of the population increase is due to the fast-growing Latino population:
[P]opulation gains in the South and West were driven overwhelmingly by minorities, particularly Hispanics, and the new districts, according to the rules of redistricting, will need to be drawn in places where they live, opening potential advantages for Democrats, who tend to be more popular among minorities. . . . [T]he most lasting political impact for Republicans and Democrats alike is the rise in the influence of Hispanic voters, particularly across Arizona, Nevada and Texas, which underscores the urgency facing both parties in finding new ways to appeal to Hispanics. In future presidential races, Democrats believe they can make inroads into Arizona and Texas, which are traditionally carried by Republicans, particularly if voters speak out against Arizona’s tough immigration law.
The way it’s shaping up, it looks like the Latino population will play a big role in determining who wins or loses many elections in the South and West. Given that, just last week, Republicans fought hard to defeat the DREAM Act and given their history of supporting (or at least being largely indifferent to) numerous anti-immigrant movements and legislation, it’s too early to say that Republicans will have an easy time in the 2010 elections.
As the Census Bureau ramps up its efforts toward the 2010 census, they’ve just released a summary sheet from their recently published State and County report that highlights some interesting geographic characteristics of the racial/ethnic minority population in the U.S.:
Four states were majority-minority in 2008: Hawaii (75%), New Mexico (58%), California (58%) and Texas (53%). The District of Columbia was 67% minority. No other state had more than a 43% minority population. . . .
Hispanics
California had the largest Hispanic population of any state in July 2008 (13.5 million), as well as the largest numeric increase within the Hispanic population since July 2007 (313,000). New Mexico had the highest percentage of Hispanics at 45%.
Los Angeles County, Calif., had the largest Hispanic population of any county (4.7 million) in 2008 and the largest numeric increase since 2007 (67,000). Starr County — on the Mexican border in southern Texas — had the highest share of Hispanics (97%).
There were 48 majority-Hispanic counties nationally; the top 10 were all in Texas.
Blacks
New York had the largest Black population of any state as of July 1, 2008 (3.5 million); Georgia had the largest numeric increase since July 1, 2007 (67,000). The District of Columbia had the highest percentage of Blacks (56%), followed by Mississippi (38%).
Cook County, Ill. (Chicago) had the largest Black population of any county (1.4 million), and Orleans Parish, La. (New Orleans) had the largest numeric increase since July 1, 2007 (16,000). Claiborne County, Miss. — on the Louisiana border — had the highest percentage of Blacks in the nation (84%).
Seventy-seven counties were majority-Black or African-American; all were in the South.
Asians
California had both the largest Asian population of any state (5.1 million) in July 2008 and the largest numeric increase of Asians since July 2007 (105,000). Hawaii is our nation’s only majority-Asian state, with people of this group comprising 54% of the total population.
Los Angeles County, Calif., had the largest Asian population of any county (1.4 million) in July 2008. Santa Clara County, Calif. (San Jose) had the largest numeric increase (19,000) since July 2007. At 58%, Honolulu County, Hawaii, was the only majority-Asian county in the nation.
Overall, the Census Bureau also estimates that as of 2008, the Asian American population stood at 15,480,349 (13,549,064 of whom are monoracial Asian) and Asian Americans comprise 5.1% of the total U.S. population of 304,059,724.