Topics & Articles
Search
or Browse the Archives
or Gets Posts by Tags
--
9/11 (3)
21st century (2)
442nd (3)
1965 Immigration Act (1)
2008 election (1)
2012 election (1)
2016 election (1)
2020 election (1)
AALDEF (2)
AAST (1)
abortion (1)
academic (62)
Academy Awards (1)
acculturation (2)
achievement (4)
ACT (1)
activism (9)
adaptation (2)
A Different Mirror (1)
adjunct (2)
admissions (8)
Advancing Justice (1)
advertising (1)
affirmative action (10)
AFL-CIO (1)
African Americans (7)
Africana Studies (1)
airport security (1)
Alaskan (1)
Alaskan Native (2)
Alice Pang (1)
Alice Walker (1)
All-American Basketball Alliance (1)
Amerasian (1)
American identity (3)
American Idol (1)
Americanized (1)
American Sociological Association (1)
Amitai Etzioni (1)
Amy Chua (2)
Andrea Jung (2)
anime (1)
Annabel Park (1)
Anna Mae He (1)
Anna May Wong (1)
announcements (15)
Anoop Desai (1)
Anthony Kim (3)
anthropology (1)
anti-Blackness (1)
anti-war (1)
Antwi Akom (1)
APA Heritage Month (2)
APAture (1)
APIAVote (2)
APICHA (2)
API Wellness (1)
apology (2)
Arab (4)
archive (2)
Arizona (3)
art (4)
Artifacts of Loss (1)
Arunachal Pradesh (1)
Asia (2)
Asia-Pacific (6)
Asian American Film Festival (2)
Asian American Policy Review (1)
Asian American Studies (49)
Asian American Studies Center (1)
Asian Australian (1)
Asian Canadian (1)
Asian Pacific Community Fund (1)
Asian Sister Participating in Reaching Excellence (1)
Asian Studies (4)
Asia Society (1)
assimilation (24)
Association for Asian American Studies (2)
athletes (8)
Atlanta (2)
attainment (1)
attitudes (3)
Australia (2)
auto industry (1)
Avon (1)
award (1)
Aziz Ansari (1)
backlash (6)
bamboo ceiling (2)
Bangladesh (1)
Baptist (1)
Barack Obama (31)
Barbara Trepagnier (1)
baseball (3)
bashing (1)
basketball (5)
beauty (1)
benefits (1)
Benito Vergara (1)
Berkeley (2)
Better Luck Tomorrow (1)
Betty Brown (1)
bias (2)
Biden (1)
bilingual (2)
bilingualism (1)
Bill Parcells (2)
Binghampton (1)
biology (1)
bipartisan (1)
biracial (3)
bisexual (2)
blackface (5)
Black Lives Matter (4)
Blacks (5)
bloc (1)
Blog Action Day (2)
blogs (8)
Bobby Jindal (2)
Bollywod (1)
book (29)
Boston (2)
Boston Globe (1)
Boy Scouts (1)
Brandeis (1)
brawl (1)
broker (1)
Bronx (1)
Bruce Lee (2)
Buddhism (5)
bullying (6)
Burma (1)
Burmese (1)
bus accident (1)
business (1)
California (1)
call for papers (6)
Cal State (1)
Cambodian (2)
Canada (2)
cancer (1)
Cao (1)
CAPAC (2)
career (1)
casting call (2)
Catholic (1)
CBS News (1)
celebrities (2)
Census (17)
census information center (1)
Center on Policy Initiatives (1)
CEO (2)
Chai Vang (1)
change (3)
Charlie Chan (2)
Cherokee (1)
China (29)
Chinatown (8)
Chinese American (10)
chinese history (1)
Chinese Progressive Association (1)
chink eye (1)
choosing america (1)
Chris Rock (1)
Christian (5)
church (1)
cinema (2)
cities (2)
citizenship (3)
civic engagement (1)
civil liberties (1)
civil rights (8)
Claremont (3)
Clarkson (1)
climate change (1)
cold war (2)
college (10)
college degree (1)
College of William and Mary (1)
colonization (1)
colorblind (13)
comedy (2)
comics (1)
commercial (1)
communication (1)
communism (2)
community (5)
community college (2)
competition (2)
comprehensive reform (3)
Compton Cookout (1)
confederate (1)
conference (15)
Congress (3)
contest (7)
Contexts (118)
contract workers (1)
contradiction (1)
contributions (3)
Coronavirus (5)
corporate (3)
Covid-19 (7)
Crazy RIch Asians (1)
Creative Steps (2)
creativity (1)
crime (1)
criminal justice (1)
Cry Wolf (1)
CSU Pomona (1)
Cuban (1)
cuisine (2)
cultural citizenship (1)
cultural icon (1)
culture (9)
CUNY (1)
Dallas Cowboys (2)
Daly City (1)
dance club (1)
dancing (1)
Daniel Dae Kim (1)
Daniel Inouye (1)
Dartmouth (1)
Daryl J. Maeda (1)
data (16)
dating (1)
Dat Phan (1)
David Cameron (1)
David Letterman (1)
death (1)
debate (1)
Deer Park (2)
defamation (1)
degree (1)
democracy (4)
Democratic (4)
demographics (16)
demography (1)
Deng Xiaoping (1)
deportation (1)
depression (2)
detentions (1)
diaspora (3)
disability (4)
discrimination (17)
Disney (1)
Disneyland (2)
dissertation (7)
diversity (15)
Diwali (1)
doctoral (1)
documentary (10)
domestic violence (1)
Dominican (1)
Donald Trump (1)
DREAM Act (1)
drivers (1)
Dusselier (1)
earthquake (3)
ECAASU (3)
economic competition (2)
economy (6)
education (20)
Edward Kennedy (1)
Edward Tom (2)
EEOC (1)
election (9)
elementary school (1)
emergency aid (1)
empire (2)
employment (8)
empowerment (1)
enclave (17)
encyclopedia (3)
English only (3)
entertainment (1)
entrepreneurship (7)
environment (1)
equality (5)
equanimous (1)
Eric Byler (1)
Eric Shinseki (2)
Erwin Chemerinsky (1)
espionage (1)
ethnic (3)
ethnic solidarity (4)
Ethnic Studies (9)
ethnography (4)
Eva Lowe (1)
Evenlyn Nakano Glenn (1)
exhibit (2)
exotic (1)
experiences (1)
extremist (1)
Facebook (1)
fact sheets (1)
faculty (5)
faith (3)
family (4)
fashion (1)
FBI (1)
fellowship (26)
figure skating (1)
Filipino American (6)
film (4)
fireworks (1)
flooding (1)
Florida (1)
folklore (1)
food (1)
football (3)
Fordham (1)
foreigner (3)
foreign exchange (1)
Formula One (1)
Fortune 500 (1)
fortune cookie (1)
Fox (1)
France (1)
Frank Wu (1)
fraternity (2)
fraud (1)
Frederick Douglas (1)
free speech (2)
fundraiser (1)
fusion (2)
future (2)
Gary Locke (4)
gay (7)
gender (6)
General Motors (1)
generation (2)
Generation X (1)
Generation Z (1)
genetics (1)
genocide (1)
geographic (2)
George Bush (1)
George Floyd (2)
Georgia (1)
Germany (1)
giveaway (1)
glass ceiling (3)
GLBT (5)
globalization (20)
gold medals (1)
golf (7)
Goodwin Liu (1)
gook (1)
graduate school (1)
grant (3)
graphic novels (1)
Greenpeace (1)
Gwen Stefani (1)
Hapa (2)
Harajuku Four (1)
Harry Connick Jr. (2)
Harry Reid (1)
Harvard (5)
hate crime (13)
hate groups (1)
Hawai'i (1)
hazing (1)
HBO (1)
health (2)
healthcare (5)
Henry Louis Gates (2)
Hepatitis (1)
heritage (9)
Hey Hey It's Saturday (1)
higher education (4)
high school (4)
hip hop (2)
Hispanic (3)
history (7)
HIV/AIDS (3)
Hmong (3)
Hmong American (5)
Hollywood (10)
homeland security (1)
homophobia (1)
honorary White (2)
housing (2)
Houston (2)
Howard Zinn (1)
human rights (2)
human trafficking (1)
Hummer (1)
humor (3)
Hunter College (1)
Huntingdon Valley (1)
Hurricane Katrina (2)
hypersexual (1)
I.M. Pei (1)
Iceland (1)
identity (20)
illegal immigration (9)
Illinois (1)
immigration (50)
impacts (3)
In-Goo Kwak (1)
inauguration (1)
inclusion (3)
income (2)
independent film (2)
India (6)
Indian (1)
Indian American (3)
Indians (1)
indigenous (3)
individual (1)
Indonesia (2)
inequality (4)
influential (5)
innovations (2)
institutional (1)
integration (7)
intelligence (1)
interactive (3)
intergenerational (1)
intermarriage (2)
internal colonialism (1)
internal migration (1)
international (3)
international adoption (4)
international relations (2)
internet (1)
internet meme (1)
internment (10)
internship (22)
interracial (8)
intersectionality (1)
intolerance (2)
inventions (2)
investment (1)
Iraq (2)
Iron Cages (1)
Islam (4)
Ivy League (1)
JACL (5)
Jacqueline Nguyen (1)
Jaguar (1)
Jake Knotts (1)
jap (2)
Japan (11)
Japanese American (10)
Japanese American veterans (2)
Jean Quan (1)
Jeff Yang (1)
Jennifer Lundquist (1)
Jennings Randolph Program (1)
Jeremy Lin (4)
Jerry Yang (1)
Jim Yong Kim (2)
Jiverly Wong (1)
jobs (30)
Joe Biden (1)
Joe Feagin (3)
John Jay College (1)
John Liu (1)
Joseph Cao (2)
Jr. (1)
Judy Chu (1)
June (2)
justice (3)
K.C. Choi (1)
Kamala Harris (1)
Karen (1)
Kearny Street (1)
Keni Styles (2)
Kirwan Institute (1)
Korean (8)
Korean American (5)
Korean Canadian (1)
Korean War (1)
Koreatown (2)
Kristi Yamaguchi (1)
labor (1)
labor union (1)
Lake Tahoe (1)
Lambda Phi Epsilon (1)
Land Rover (1)
language (6)
Laotian (4)
Larry Shinagawa (1)
Latin America (2)
Latinos (10)
law enforcement (1)
Lawrence Summers (1)
layoffs (1)
leaders (1)
leadership (3)
LEAP (3)
Legaci (1)
legal (1)
legalization (1)
legislative summit (1)
legislator (1)
Leland Yee (1)
lesbian (6)
Lewis Hamilton (1)
LGBT (1)
liberal (2)
Library of Congress (1)
linguistics (1)
Links (86)
literature (5)
Little Saigon (5)
Lori Phanachone (1)
Los Angeles (2)
Louisiana (1)
LPGA (3)
Luis Ramirez (1)
Lumina (1)
Lunar New Year (4)
mainstream (1)
majority (1)
Male Studies (1)
manga (1)
Manny Pacquiao (1)
map (2)
marital status (1)
Mark Chiang (1)
marriage (1)
Martin Luther King (3)
masculinity (3)
mayor (1)
McCain (3)
Meb Keflezighi (1)
media (24)
media images (10)
medical (1)
melting pot (1)
mental (1)
mental health (8)
Mexican (2)
Mexico (1)
Michael Chang (2)
Michelle Kwan (1)
Michelle Rhee (1)
microaggressions (1)
middleman (1)
migrant workers (2)
migration (3)
Mike Honda (1)
Miliann Kang (1)
military (3)
Milken Foundation (1)
millenials (1)
Millennial (1)
Mindy Yip (1)
Minnesota (1)
minority (2)
Mirai Nagasu (1)
misogyny (1)
Missouri University (2)
Miss USA (1)
MIT (1)
mixed race (9)
mixed root (1)
Mochi (1)
model minority (20)
Monica Chiu (1)
movies (9)
Muhammad Ali (1)
Mulan (1)
multiculturalism (6)
multimedia (3)
multiracial (10)
murder (2)
museum (1)
music (4)
Muslim (12)
MySpace (1)
NAAS (1)
nail salons (1)
names (2)
Nanjing (1)
Nano (1)
national identity (1)
nationalism (2)
native (1)
Native American Indian (2)
Native Hawaiian (2)
nativism (2)
natural disaster (2)
naturalization (1)
neo-nazi (1)
Nepal (1)
New England (1)
New Orleans (3)
newspaper (1)
New York Asian Women's Center (1)
New York City (4)
New Yorker (2)
New York Times (1)
Nghia Vo (1)
Nguyen (1)
Nikki Haley (3)
non-profit (5)
noose (1)
Norman Mineta (2)
North Carolina (1)
North Korea (2)
Norway (1)
nurses (1)
OCA (1)
occupation (5)
Olympics (7)
online survey (16)
opening ceremony (1)
Organization of Chinese Americans (3)
organizing (1)
Orientalism (6)
outsourcing (2)
Padma Lakshmi (1)
Pakistan (1)
Paralympics (1)
parenting (6)
patriarchy (1)
patriotism (1)
Paula Rothenberg (1)
PBS (1)
Penn State (1)
Pennsylvania (1)
People's History (1)
percent minority (1)
perpetual foreigner (1)
personality (1)
Pew Research (4)
PGA (1)
Ph.D. (1)
Philadelphia (7)
Philippines (2)
photos (1)
physical activity (1)
Pi Alpha Phi (1)
pictures (1)
Pitzer (2)
police (2)
police brutality (2)
policy (5)
political candidate (2)
political correctness (1)
political participation (8)
politics (14)
polling (2)
polls (2)
popular culture (5)
population (5)
porn (2)
portrayal (5)
positions (15)
post-racial (2)
postdoc (9)
Pottsville (1)
poverty (3)
preferences (1)
prejudice (7)
President (5)
presidential election (6)
pressure (2)
prestige (1)
Princeton (2)
profession (1)
professor (5)
propaganda (1)
Proposition 8 (1)
protests (5)
psychology (2)
public health (1)
public opinion (3)
public sociology (8)
publishing (1)
Puerto Rican (1)
Puerto Ricans (1)
purchasing power (2)
Purdue University (1)
Queens College (1)
queer (2)
questionnaire (1)
Qunnipiac (1)
race (12)
race relations (9)
racial justice (2)
racial profiling (10)
racing (1)
racism (22)
reality tv (5)
reapportionment (1)
rebirth (1)
recession (12)
Red Star Press (1)
refugee (4)
relief (1)
religion (11)
report (2)
representation (8)
research (34)
reverse discrimination (1)
reverse redlining (1)
Rewari (1)
Richard Alba (1)
Rima Fakih (1)
riot (1)
Robinson Crusoe (1)
Ronald Takaki (1)
roommate (1)
Rush Limbaugh (1)
Rutgers University (1)
Ryder Cup (1)
Sacramento (1)
safety (1)
Saigon (1)
Saints (1)
Salvadoran (1)
same sex (1)
same sex marriage (1)
Samoa (2)
Sam Yoon (1)
San Diego (1)
San Francisco (4)
San Francisco 49ers (1)
San Francisco State (2)
Sanjay Gupta (1)
San Jose (1)
Sarah Palin (1)
satire (2)
satisfaction (2)
Saturday Night Live (1)
Saudi Arabia (1)
scholarship (14)
Scripps (1)
Seattle (2)
second generation (3)
Secretary of Energy (1)
secret identities book (1)
segregation (6)
self employment (3)
Senator (1)
sentencing (1)
SERCAAL (1)
settlement (1)
Seung Hui Cho (3)
sexism (1)
sexual coercion (1)
sexual orientation (1)
Shenandoah (1)
shooting (2)
Sikh (1)
sites (14)
skinheads (1)
slander (1)
Slate (1)
slavery (3)
Slumdog Millionaire (1)
Smithsonian (1)
social (1)
social class (3)
social justice (9)
social movement (3)
social networking (2)
social support (1)
socioeconomic (4)
sociology (30)
Somaly Mam (1)
Songs with a Voice (1)
Sonia Sotomayor (2)
South America (1)
South Asian (2)
South Carolina (1)
Southeast Asian (3)
South Korea (4)
Spain (1)
spirituality (3)
sports (15)
spying (1)
State Department (1)
State Farm (1)
statistics (13)
status (1)
stereotypes (15)
Steven Chu (5)
stigma (1)
stimulus (1)
Strangers from a Different Shore (1)
strike (1)
student affairs (1)
student demonstration (1)
students (7)
study (35)
study abroad (1)
suburban (3)
success (2)
suicide (2)
sumo (1)
Super Bowl (1)
superpower (2)
support (1)
Supreme Court (2)
survey (9)
swimming pool (2)
swine flu (2)
swing vote (1)
symbol (1)
Taiwan (1)
Taiwanese (2)
Tammy Duckworth (1)
tank man (1)
TARP (1)
Tata Motors (1)
teaching (4)
Tea Party (1)
technology (1)
television (4)
tennis (1)
tensions (5)
tenure (1)
terrorism (5)
test scores (1)
Tet (2)
Texas (1)
Thai (1)
Thailand (1)
Thanksgiving (1)
theater (1)
the south (2)
The Valley Club (2)
Thich Nhat Hanh (1)
Tiananmen Square (1)
Tibet (1)
Tiger Mother (2)
Tiger Woods (3)
Tila Tequila (1)
Time magazine (2)
Tim James (1)
Tim Wise (2)
tolerance (2)
Toyota (2)
Toys R Us (1)
training (1)
transgender (2)
transnational (8)
transracial adoption (2)
Tufts (3)
tv (2)
UC Davis (1)
UC Irvine (2)
UCLA (5)
UC Santa Barbara (1)
UCSD (1)
UMass Boston (2)
UNC Chapel Hill (1)
underclass (1)
undergraduate (2)
undocumented (12)
unity (3)
Univ. of Illinois (1)
University of California (4)
University of Colorado (1)
University of Connecticut (2)
University of Hawai'i (1)
University of Maryland (4)
University of Massachusetts (1)
University of Texas Austin (2)
University of Utah (1)
UPenn (1)
USC (1)
Vancouver (1)
veterans (2)
victory (1)
video (9)
Viet Kieu (1)
Viet Nam (7)
Vietnamese American (15)
Viet Nam War (9)
village (1)
Vincent Chin (3)
violence (8)
Virginia Asian Chamber of Commerce (1)
Virginia Tech (3)
voting (5)
voting rights (3)
Wadhwa (1)
wage (1)
Wakamatsu (1)
Wallace Loh (1)
wealth (1)
weddings (1)
wellness (1)
we shall overcome (1)
whaling (1)
Whatever It Takes (1)
White (4)
White flight (1)
White House Initiative (3)
White privilege (16)
White supremacy (8)
William Hung (2)
Winter Olympics (2)
Wisconsin (1)
women (7)
women's studies (1)
working mothers (1)
workplace (4)
workplace discrimination (1)
workshop (2)
world opinion (1)
World War II (2)
writing competition (3)
xenophobia (5)
Y.E. Yang (1)
Yao Ming (1)
Year of the Dragon (1)
Yellowface (3)
yellow lens (1)
Yellow Peril (5)
Yi Jianling (1)
Yosemite (1)
youth (2)
Youtube (3)
Yuri Kochiyama (1)
Zhao Ziyang (1)
Most Popular Books on Asian-Nation
Miscellaneous
All posts copyright © 2001- by C.N. Le .Some rights reserved . WordPress
Academic Version: Applying my personal experiences and academic research as a professor of Sociology and Asian American Studies to provide a more complete understanding of political, economic, and cultural issues and current events related to American race relations, and Asia/Asian America in particular.
Plain English: Trying to put my Ph.D. to good use.
March 28, 2012 Written by C.N.
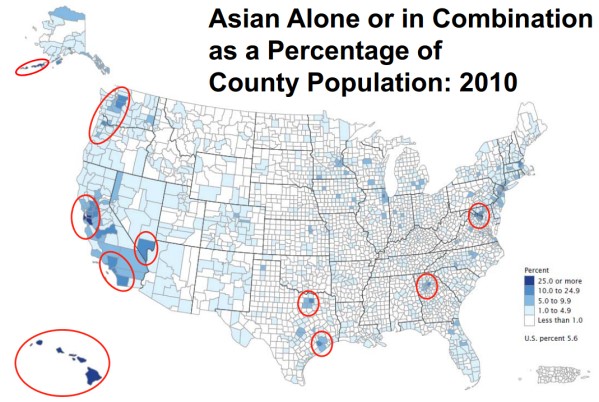
The U.S. Census Bureau has finalized their official data on our nation’s population and has just released their report brief “The Asian Population: 2010 ” that summarizes its major findings about the Asian American population in 2010 , and in particular, how it compares to the last decennial Census taken in 2000. Below are some of the most significant highlights.
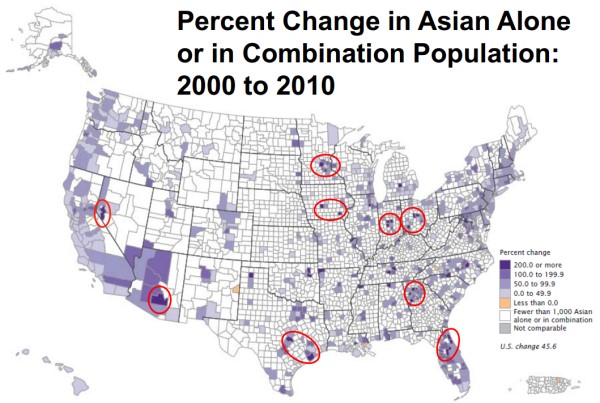
Growth Since 2000
The Asian American population (monoracial and mixed-race) grew from 11.9 million in 2000 to 17.3 million in 2010. This represents an increase of 45.6% since 2000. This proportional increase from 2000 is the highest of all the major racial/ethnic groups (in comparison, the Latino/Hispanic population grew 43% from 2000 to 2010 .
Increases Within Each Ethnic Group
Among the six largest Asian ethnic groups (monoracial and mixed-race), who collective make up over 87% of the total Asian American population, Indians experienced the largest increase — 67.6% — since 2000. All Asian ethnic groups (monoracial and mixed-race) that had a population of at least 1,000 in 2000, Nepalese experienced large increases in their population — from 9,399 to 59,490 in 2010, an increase of 533%. Overall, the largest Asian ethnic group is the Chinese at 3.8 million (monoracial and mixed-race).
Huge Increase in Mixed-Race Asian American Population
Mixed-race Asian Americans (those who self-identified as having some Asian ancestry) increased from 1.6 million in 2000 to 2.6 million in 2010, an increase of 60%. Of all mixed-race Asian Americans, 61% self-identified as half White and half Asian.
Geographic Distribution
Again, you can read more findings from the 2010 Census about the Asian American population in the Census Bureau’s recently-released summary report, The Asian Population: 2010 .
March 19, 2009 Written by C.N.
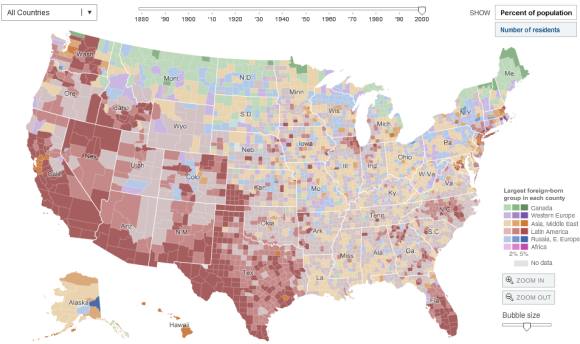
I just came across a nifty interactive infographic from the New York Times that tracks geographic settlement patterns of major racial/ethnic immigrant groups throughout the United States by decade, from 1880 to 2000: the Immigration Explorer .
For every group included in the graphic, you will notice that as the decades pass, their settlement patterns become more dispersed throughout the country. In other words, in the past, immigrants would concentrate in the traditional major metropolitan areas of New York, Los Angeles, San Francisco, and Chicago.
But these days, immigrants have spread out and are settling into new “gateway” areas — areas that aren’t used to having large immigrant populations. And unfortunately, these demographic shifts can and have led to some tensions between old-time residents and the new arrivals. For more research on the new settlement patterns of contemporary immigrants, I recommend books such as: